
Posts tagged Monitoring
Join Live Webinar Series - Boost Your System Performance: Troubleshoot Faster & Cut GC Waste
Published on 07 Oct 2024
by Dominika Tasarz
Topics:
Production Features,
Monitoring,
news and events,
Payara Events,
Java,
performance
|
0 Comments

We’re excited to invite you to two informative webinars happening later this month, which we're running in collaboration with yCrash.
During the first webinar, you will learn how to capture 16 essential artifacts that can dramatically improve your ability to troubleshoot production problems, ensuring faster resolution times. The second webinar dives into how enterprises unknowingly waste millions on garbage collection inefficiencies and provides 9 practical tips to optimize your application’s GC performance. Whether you're facing production issues or looking to enhance scalability, these sessions offer invaluable knowledge to streamline your approach and maximize your savings. Read on to find out more and register!
Ensuring Seamless Operations and Maximum Profitability: Key Insights on Application Server Efficiency and SLAs - Part 2
Published on 12 Aug 2024
by Chiara Civardi
Topics:
Ops Teams,
Upgrade,
DevOps,
Monitoring,
Developer,
Payara Support,
Migration,
Payara InSight,
deployment group,
service
|
0 Comments

Robust and efficient application servers are crucial for companies relying on software applications, whether supporting e-commerce platforms, financial services portals, or internal operations. To ensure smooth operations and deliver seamless services to users, it's essential to partner with vendors who can provide a system runtime that offers maximum uptime. This reduces costs and optimizes performance, profitability, and user satisfaction. Effective service level agreements (SLAs) with these vendors play a key role in minimizing disruptions and ensuring that your applications run efficiently and reliably.
In this blog post, we share insights from industry players on what to look for in application runtime SLAs to minimize disruptions.
Ensuring Seamless Operations and Maximum Profitability: Key Insights on Application Server Efficiency and SLAs - Part 1
Published on 18 Jul 2024
by Chiara Civardi
Topics:
Ops Teams,
Upgrade,
DevOps,
Monitoring,
Developer,
Payara Support,
Migration,
diagnostics
|
0 Comments

Robust and efficient application servers are essential for companies relying on software applications, whether these support e-commerce platforms, financial services portals or internal operations. To help ensure smooth operations, deliver seamless services to users and generate revenue, it’s important that the runtime in place can offer maximum uptime to reduce cost while optimizing performance, profitability and user satisfaction.
In this blog post, we share insights from industry players on the impact of unexpected application server issues and downtime as well as how to reduce them.
Watch the Recording: Effortless Jakarta EE Application Monitoring With Payara Monitoring Console
Published on 03 Aug 2023
by Dominika Tasarz
Topics:
Monitoring,
news and events,
Payara Events,
Jakarta EE
|
0 Comments
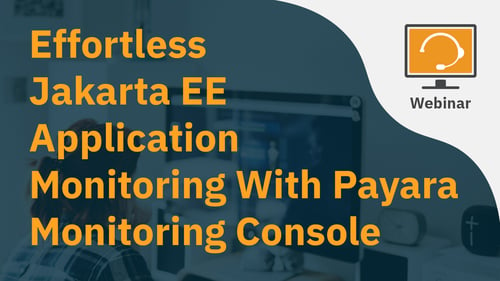
In this recorded webinar we explore how Payara Monitoring Console helps you streamline your Jakarta EE and MicroProfile application monitoring, troubleshooting, and management. Discover how the Payara Monitoring Console streamlines monitoring workflows, improves application performance, and enables faster incident response for your organisation.
Monitoring JMX Using the Notification Service
Published on 11 Aug 2021
by Rudy De Busscher
Topics:
How-to,
JVM,
Monitoring,
JMX,
Notifier
|
2 Comments
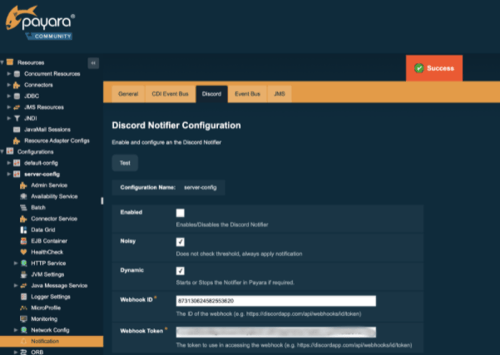
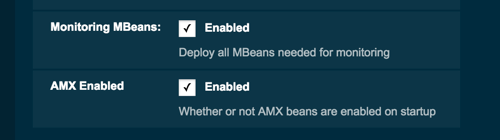
Within Payara Server, the JMX system is used to store all the data that the monitoring service captures of the modules within the runtime.
You can use any tool that can connect to the JMX system to collect these data and monitor the environment. Besides this direct access, the notifier service can send this information to various channels so that the data can be integrated with external systems.
The Notifier service is modular since October 2020 with version 5.2020.5 so that you can include only those notifiers that you are interested in and use within your environment. These notifiers cover a wide range of channels, from typical destinations like email, JMS Queues, over APM tools like DataDog and NewRelic to communication platforms like Teams, Slack, and Discord.
In this blog, we take a look at enabling JMX Monitoring for the JVM Heap Size, monitoring the process Heap Size, and then sending that information to a Discord channel.
10 Strategies for Developing Reliable Jakarta EE Applications for the Cloud
Published on 27 Nov 2020
by Fabio Turizo
Topics:
Java EE,
Microservices,
Clustering,
Scalability,
Cloud,
Monitoring,
Cloud-native,
JakartaEE,
Payara Platform
|
0 Comments

What happens when an application designed for a small user base needs to be scaled up and moved to the cloud?
It needs to live in a distributed environment: responding to an appropriate number of concurrent user requests per second and ensuring users find the application reliable.
Though Jakarta EE and Eclipse MicroProfile can help with reliable clustering, there is no standard API in Jakarta EE that defines how clustering should work currently. This might change in the future, but in the meantime, this gap must be filled by DevOps engineers.
In this blog, we will cover 10 technical strategies to deal with clustering challenges when developing Jakarta EE and MicroProfile for cloud environments.
Payara Platform監視コンソール
Published on 08 Jan 2020
by Jan Bernitt
Topics:
Monitoring,
Japanese language,
JakartaEE,
Payara Platform 5,
New Releases
|
2 Comments
嬉しいお知らせです。Payara Platform 5.194から、Payara Serverにはサーバーの状態を可視化できる組み込みの監視コンソールが搭載されます。
Coming Soon: Payara Platform Monitoring Console
Published on 21 Nov 2019
by Jan Bernitt
Topics:
Monitoring,
JakartaEE,
Payara Platform 5,
New Releases,
Payara InSight
|
1 Comment
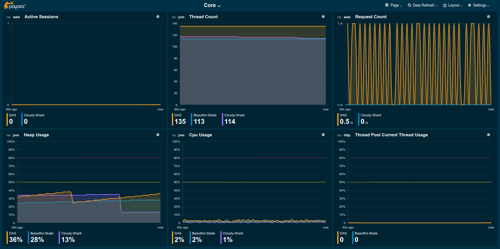
We are happy to announce that from the Payara Platform 5.194 release onwards Payara Server ships with a built-in monitoring console that allows a visual peek under the hood of the server.
The Health Check Service In-Depth - Payara Server 5
Published on 16 Oct 2019
by Ondro Mihályi
Topics:
What's New,
Ops Teams,
How-to,
Healthcheck,
Security,
DevOps,
Monitoring,
Payara Server 5,
Notifier
|
4 Comments
This is an updated blog of the original which was published in May 2016
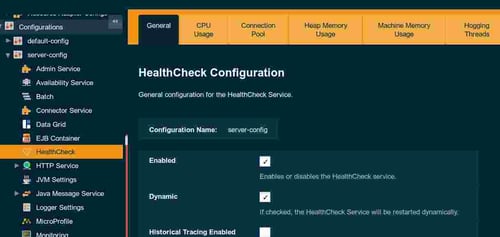
Payara Server provides the Health Check Service for automatic self-monitoring in order to detect future problems as soon as possible. When enabled, the Health Check Service periodically checks some low level metrics. Whenever it detects that a threshold is not met, it triggers alert notifications that allow to detect undesired behavior and predict possible failures. All of these automatic checks are very lightweight and run with a negligible impact on performance.
Expose JMX Bean Values through MicroProfile Metrics
Published on 02 Jan 2019
by Rudy De Busscher
Topics:
MicroProfile,
Monitoring,
JMX
|
0 Comments
Payara Server provides many metrics within JMX beans. The most interesting metrics are the statistics around pools for HTTP threads and JDBC Connection pooling.
On the other hand, Payara Server also implements the MicroProfile Metrics specification. The retrieval of useful metrics from the running instance in the areas of CPU, memory, Class loading, and other MicroProfile specifications (like Fault Tolerance), are possible through the implementation of the MicroProfile Metrics in Payara Server.