Monitoring JMX Using the Notification Service
Originally published on 11 Aug 2021
Last updated on 12 Aug 2021
.jpg?width=200&name=Payara%20ECE%202018%20sponsor%20(2).jpg) by Rudy De Busscher
by Rudy De Busscher
Within Payara Server, the JMX system is used to store all the data that the monitoring service captures of the modules within the runtime.
You can use any tool that can connect to the JMX system to collect these data and monitor the environment. Besides this direct access, the notifier service can send this information to various channels so that the data can be integrated with external systems.
The Notifier service is modular since October 2020 with version 5.2020.5 so that you can include only those notifiers that you are interested in and use within your environment. These notifiers cover a wide range of channels, from typical destinations like email, JMS Queues, over APM tools like DataDog and NewRelic to communication platforms like Teams, Slack, and Discord.
In this blog, we take a look at enabling JMX Monitoring for the JVM Heap Size, monitoring the process Heap Size, and then sending that information to a Discord channel.
Enable JMX Monitoring
While monitoring at the server level is enabled by default, it must be specifically enabled for each module. To receive monitoring data from Payara Server, you need to:
- Enable the Monitoring Service for a specific module
- Configure a notifier
- Enable JMX Monitoring
If you don't already have it enabled, the monitoring service can be started by using an Asadmin CLI command or via the Admin Console.
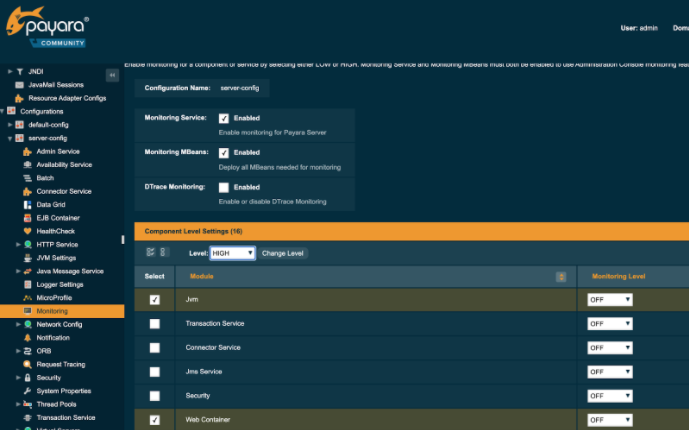
To have the Heap Size data available, make sure you set the module JVM to level HIGH.
Via asadmin commands
The monitoring service itself is enabled by default. However, should you need to enable the monitoring service, use the following Asadmin CLI command:
asadmin> enable-monitoring |
You will then need to decide which module (such as the ejb-container, etc) you wish to monitor. There are three levels of logging: OFF (the default), where no data is captured, LOW, where only very basic data is captured, and HIGH, where all data of the module is captured. To view the current logging status of all modules, run the following command:
asadmin> get "server.monitoring-service.*"
  ...
  server.monitoring-service.module-monitoring-levels.connector-connection-pool=HIGH
  server.monitoring-service.module-monitoring-levels.connector-service=HIGH
  server.monitoring-service.module-monitoring-levels.deployment=LOW
  server.monitoring-service.module-monitoring-levels.ejb-container=HIGH
  ...
To start logging from a module, run the enable-monitoring command, separating multiple modules with colons:
asadmin> enable-monitoring --modules deployment=HIGH:ejb-container=HIGH:web-container=HIGH
Via the Admin Console
To enable monitoring for a module via the admin console, navigate to Configurations → <Your Configuration> → Monitoring. Select the modules you wish to enable from the list and set their Level to "HIGH":

Configuring a Notifier
As already mentioned, the Notifier Service is working in a modular fashion and by default, not all available notifiers are present in a Payara Community download. It contains the notifiers for sending notifications to the log file, a JMS queue, and to the Domain Data Grid using a queue or as CDI event.
The other notifiers are available for download within the Payara Nexus server within the payara-artifacts repository https://nexus.payara.fish/#browse/browse:payara-artifacts.
Each notifier consists of two jar files. The core jar file contains the notifier functionality and the asadmin commands to configure and use them. The console-plugin one contains the Admin Console screens and is only required if you want to configure the notifier from the Admin Console.
For this blog, we download the Discord Notifier jar files and place them in the <payara-home>/glassfish/modules directory.
Configure the Discord WebHook
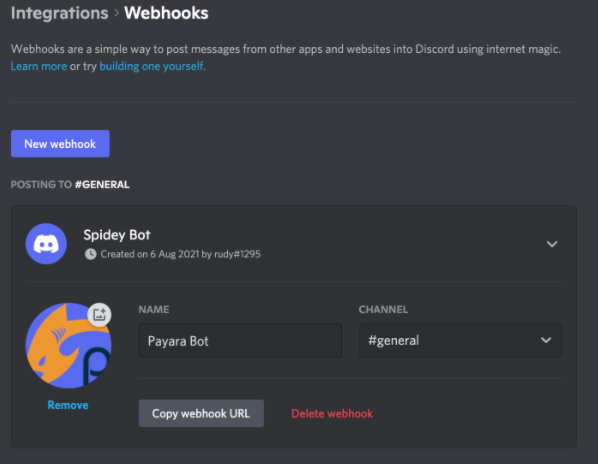
Within the Discord application, you need to define a webhook so that messages can be received and posted in a specific channel. You can find the option to create a webhook within the integrations section of the configuration.

You need to define the name for the bot which is also used when showing messages coming from the webhook and the channel they will appear in.
The webhook URL is required to configure the Payara Discord notifier. The URL has the format https://discord.com/api/webhooks/<webhook-id>/<webhook-token>.
Those two values must be entered in the config, using the Admin Console or the Asadmin CLI tool.
Configure Notifier with the Admin Console
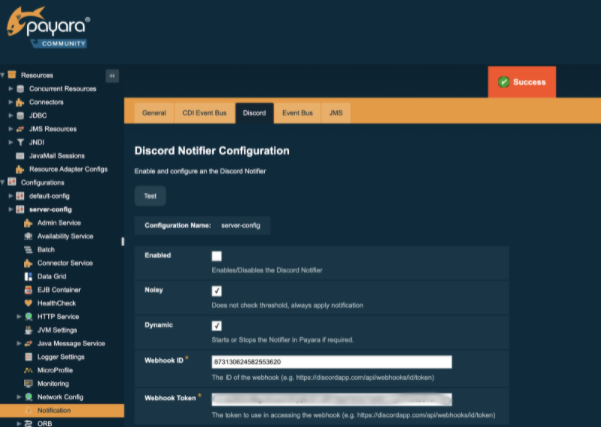
The notifiers can be found within the Notifier section of the configuration block. You can enable the notifier, define the webhook id and token and test out the configuration.

You can perform the same configuration using the following command.
asadmin> set-discord-notifier-configuration --enabled=true --dynamic=true --webhookId=xxx --webhookToken=yyy
The dynamic true option allows starting the Discord notifier without the need to start the notifier with a restart of the Payara Server itself. The xxx and yyy values are respectively the id and token of the webhook you have created with Discord.
You can test out if the integration is working by clicking on the test button within the Admin Console screen for the Discord Notifier configuration or using the asadmin command:
asadmin> test-notifier-configuration --notifiers=discord-notifier
You should see a message similar to the following screenshot when everything works well.

Configure Monitoring Service
The last step we need to perform is to activate the Discord notifier within the Monitoring service. With this step, we also configure what JMX mbean values we want to log and define the notifiers / channels the message is sent to.
This configuration can be done again either with the Admin Console or the Asadmin CLI tool.
Enable JMX Monitoring Logging
Via Asadmin CLI commands
We need to execute 2 commands, the first one activates the logging for JMX beans. It defines the frequency, every 5 minutes in the example, the information is sent to the notifiers, and which notifiers get the log messages.
asadmin> set-jmx-monitoring-configuration --setNotifiers=log-notifier,discord-notifier --logfrequency=5 --logfrequencyunit=MINUTES --dynamic=true --enabled=true --target=server-config
The second command defines the JMX values that are logged. As mentioned before, we will log the Heap Size of the JVM process. The corresponding command for this is:
asadmin> set-jmx-monitoring-configuration --addattribute=attributeName=HeapMemoryUsage objectName=java.lang:type=Memory
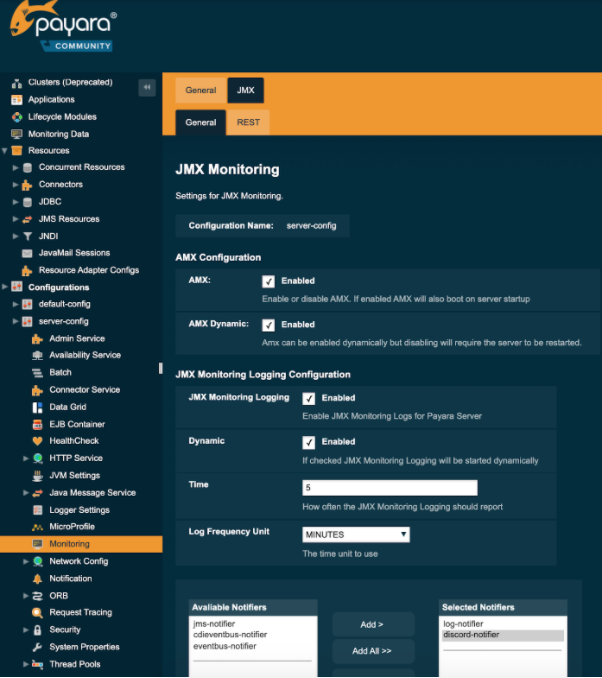
Via Admin Console
The same information can also be provided through the Admin Console as shown in the following screenshots.

 When all these configuration steps are performed, you will see the notification messages within the Discord channel you have configured.

Related Posts
Join Live Webinar Series - Boost Your System Performance: Troubleshoot Faster & Cut GC Waste
Published on 07 Oct 2024
by Dominika Tasarz
0 Comments
We’re excited to invite you to two informative webinars happening later this month, which we're running in collaboration with yCrash.
During the first webinar, you will learn how to capture 16 essential artifacts that can dramatically ...
Ensuring Seamless Operations and Maximum Profitability: Key Insights on Application Server Efficiency and SLAs - Part 2
Published on 12 Aug 2024
by Chiara Civardi
0 Comments

