Posts tagged How-to
Continuous Integration and Continuous Deployment for Jakarta EE Applications Made Easy
Published on 25 Mar 2024
by Luqman Saeed
Topics:
How-to,
Payara Cloud,
Jakarta EE
|
1 Comment
Continuous Integration and Continuous Deployment (CI/CD) activities are designed to convey your Jakarta EE applications to end users. Thanks to the unique flexibility of Jakarta EE, multiple CI/CD options are available to software developers. In effect, these are independent from your specific Jakarta EE.
Watch the video below to learn more about some of the CI/CD alternatives available, what they can offer as well as guide you through how you can implement them. You will be able to follow a demonstration on configuring GitHub Actions for CI/CD and deploying a Jakarta EE applications from the IDE, through GitHub, and onto Payara Cloud. You will also be able to learn how to deploy and manage your applications on Payara Cloud.
Easy Jakarta EE Integration Testing with the Payara Platform and Testcontainers
Published on 24 Mar 2022
by Fabio Turizo
Topics:
Docker,
How-to,
Cloud,
JakartaEE
|
0 Comments
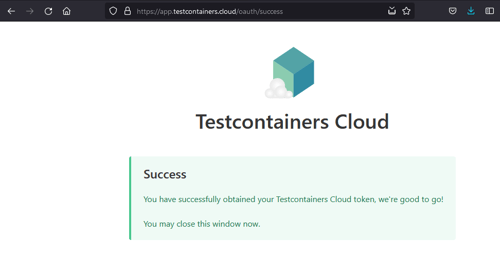
One major issue when developing modern enterprise applications is the "works on my machine" problem: when an application works well on your machine but is not functional in production or even on a colleague's machine. An even more prevalent problem is to maintain the quality of ever-changing applications during development and maintenance.
This is especially prevalent when Jakarta EE applications are developed and not properly tested in an isolated and cohesive manner. Proper integration testing helps to avoid both the "works on my machine" problem, and ensures developers can change the application effectively without breaking it. However often teams struggle with it, due to a lack of standardized testing solutions and the unpredictability of real-world conditions.
Here, I present an effective method for Jakarta EE integration testing, using Payara Platform and Testcontainers in my example.
Monitoring JMX Using the Notification Service
Published on 11 Aug 2021
by Rudy De Busscher
Topics:
How-to,
JVM,
Monitoring,
JMX,
Notifier
|
2 Comments
Within Payara Server, the JMX system is used to store all the data that the monitoring service captures of the modules within the runtime.
You can use any tool that can connect to the JMX system to collect these data and monitor the environment. Besides this direct access, the notifier service can send this information to various channels so that the data can be integrated with external systems.
The Notifier service is modular since October 2020 with version 5.2020.5 so that you can include only those notifiers that you are interested in and use within your environment. These notifiers cover a wide range of channels, from typical destinations like email, JMS Queues, over APM tools like DataDog and NewRelic to communication platforms like Teams, Slack, and Discord.
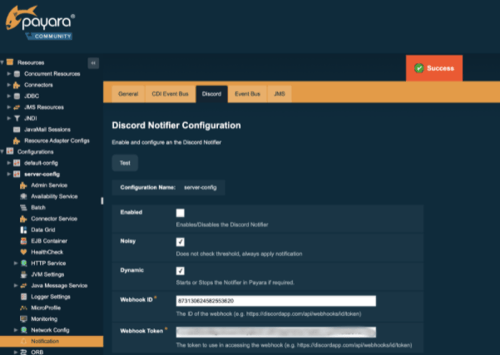
In this blog, we take a look at enabling JMX Monitoring for the JVM Heap Size, monitoring the process Heap Size, and then sending that information to a Discord channel.
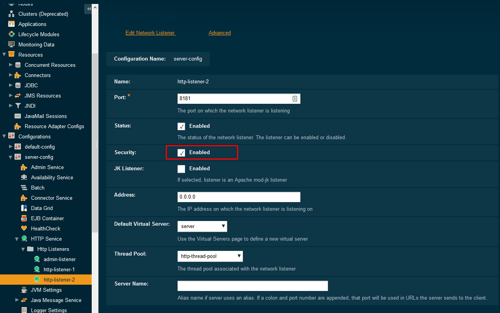
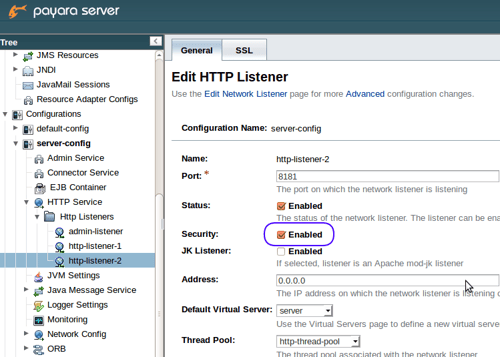
カスタム SSL証明書を用いた Payara Serverのセキュア化
Published on 10 May 2021
by Ondro Mihályi
Topics:
How-to,
Security,
Admin
|
0 Comments
How to Improve Domain Data Grid Performance
Published on 26 Jan 2021
by Fabio Turizo
Topics:
Microservices,
Clustering,
How-to,
Payara tools
|
0 Comments
One of the cornerstones of any modern Payara Platform architecture is the use of the Domain Data Grid. The Domain Data Grid allows multiple Payara Server or Payara Micro instances to join and form a robust cluster of interchangeable nodes that can share data between each other and grant High Availability and Failover capabilities to any applications deployed in the cluster.
The Health Check Service In-Depth - Payara Server 5
Published on 16 Oct 2019
by Ondro Mihályi
Topics:
What's New,
Ops Teams,
How-to,
Healthcheck,
Security,
DevOps,
Monitoring,
Payara Server 5,
Notifier
|
4 Comments
This is an updated blog of the original which was published in May 2016
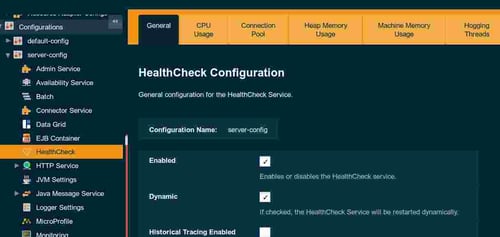
Payara Server provides the Health Check Service for automatic self-monitoring in order to detect future problems as soon as possible. When enabled, the Health Check Service periodically checks some low level metrics. Whenever it detects that a threshold is not met, it triggers alert notifications that allow to detect undesired behavior and predict possible failures. All of these automatic checks are very lightweight and run with a negligible impact on performance.
カスタムSSL証明書を用いたPayara Serverのセキュア構成
Published on 27 Sep 2018
by Ondro Mihályi
Topics:
How-to,
Security,
Admin,
Japanese language
|
0 Comments
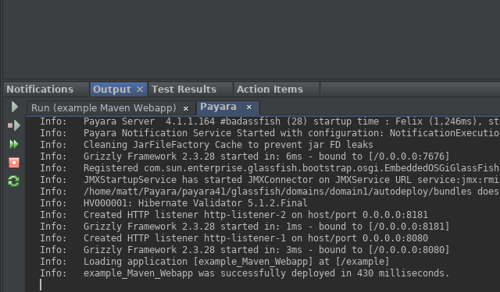
Payara for Beginners - Payara ServerをNetBeansに追加する
Published on 17 Aug 2018
by Matthew Gill
Topics:
Maven,
Payara Server Basics,
How-to,
NetBeans,
Japanese language
|
0 Comments
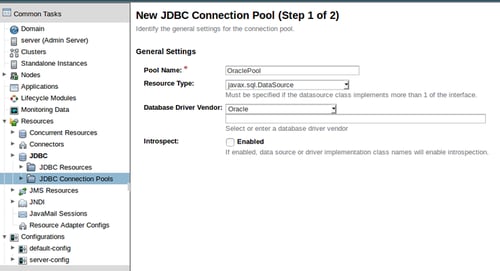
Payara para principiantes: Integrando Payara Server con Oracle 11g XE
Published on 18 Jul 2018
by Matthew Gill
Topics:
Payara Server Basics,
How-to,
Ubuntu,
Spanish language
|
1 Comment
La mayoría de las aplicaciones web modernas necesitan alguna manera de almacenar datos en una base de datos. Generalmente, Oracle proporciona la mejor solución de RDBMS en lo que respecta a seguridad, soporte y escalabilidad. Oracle XE es la versión más adecuada para desarrolladores para proyectos pequeños o personales, y además debería ser compatible con la versión completa de la base de datos Oracle. Esta guía te adyudará a configurar tanto Oracle XE y Payara Server.
Payara para principiantes: Añadir Payara Server a NetBeans
Published on 17 Jul 2018
by Matthew Gill
Topics:
Maven,
Payara Server Basics,
How-to,
NetBeans,
Spanish language
|
5 Comments
Cuando estás probando una aplicación para ejecutarla en Payara Server, continuamente probar la aplicación desde tu IDE es extremadamente util (ese es su proposito, despues de todo). Si estás utilizando NetBeans esto es muy sencillo. Sigue los pasos de este blog para configurar Payara Server en NetBeans para ejecutar tus aplicaciones web.

