
Originally published on 21 Nov 2019
Last updated on 14 Jul 2021

We are happy to announce that from the Payara Platform 5.194 release onwards Payara Server ships with a built-in monitoring console that allows a visual peek under the hood of the server.
While there always have been data APIs that allowed for extracting performance and status numbers from the server that could be visualised with the help of external tools, we wanted to offer users a faster way to take a peek inside the server with less setup.
With the features developed so far the primary goal has been to offer a customisable console that server administrators and developers alike can quickly enable for local installations or put up on a big TV screen to see the live status of production systems.
While the console is very flexible with user defined metrics and monitoring pages we still wanted to focus on ease of use, make the console mostly self-explanatory, and let it reflect user configurations directly in the view.
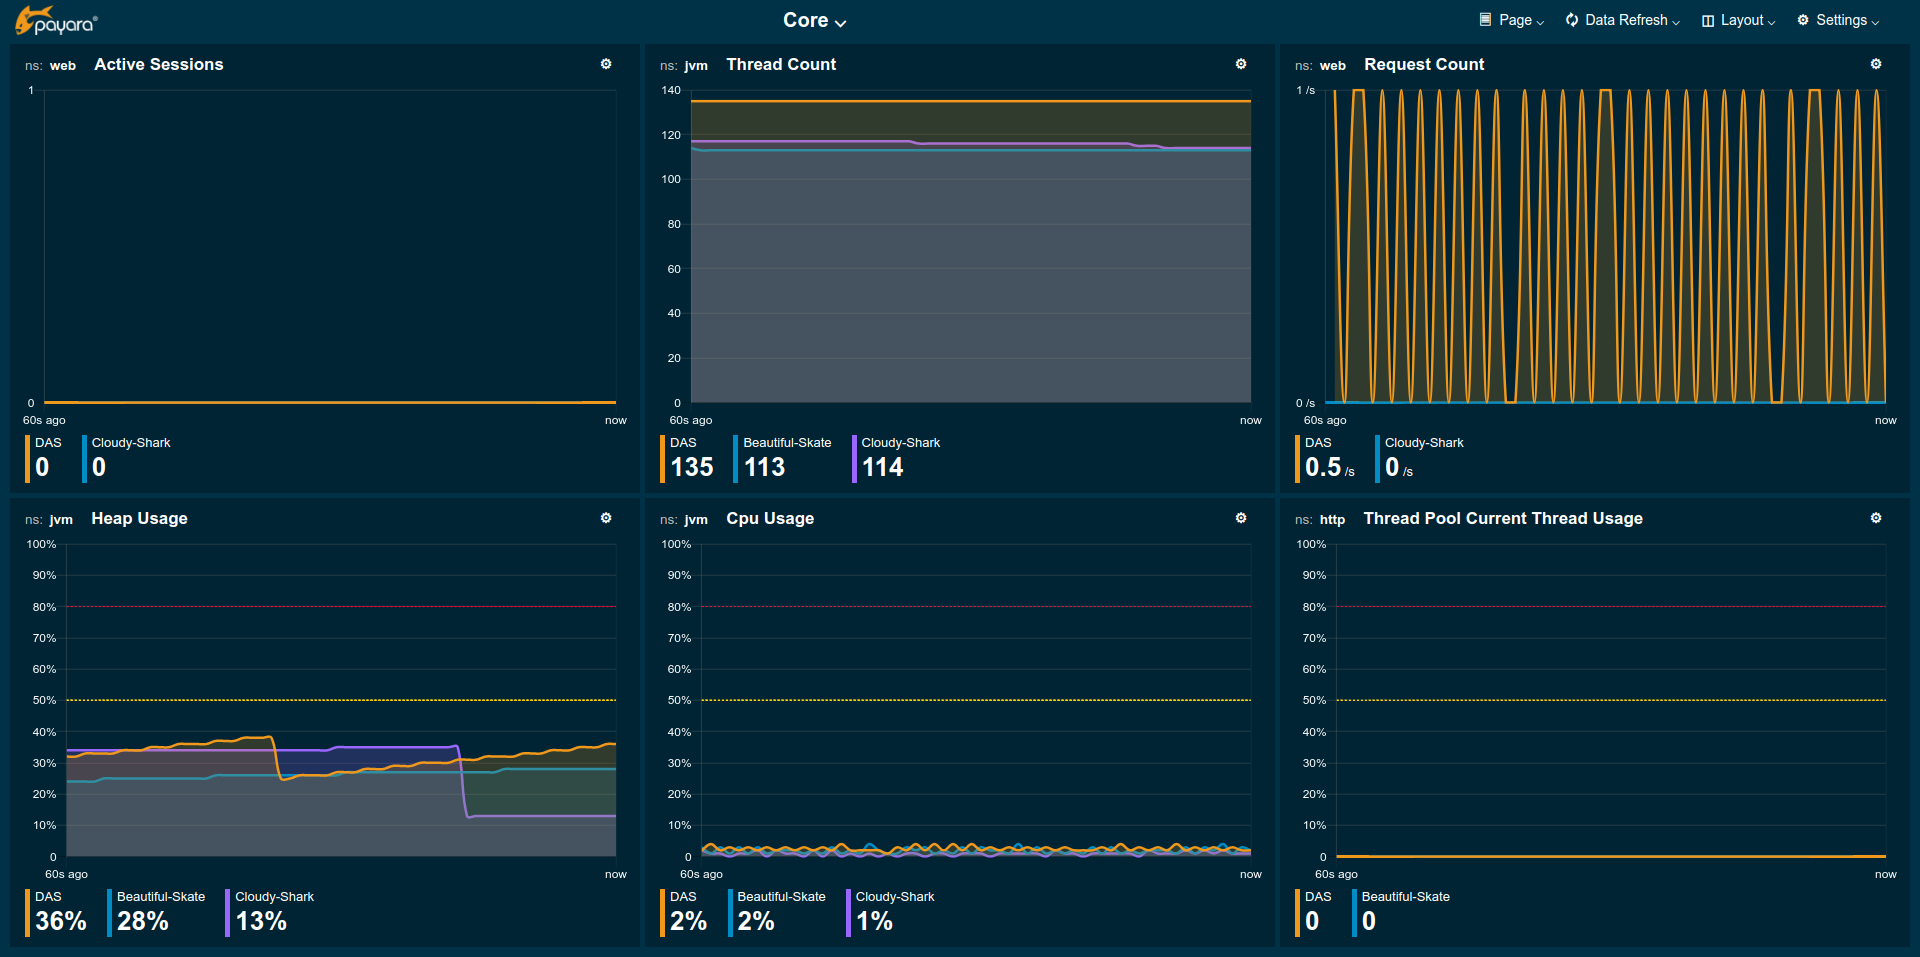
Image: Monitoring Console - Core Page
Noteworthy Features of the Payara Platform Monitoring Console
Fully Customisable: Initially the console has a number of predefined pages on central performance and status metrics of the server. New pages can be created and populated with metric widgets. All pages can be further tweaked and extended by the user. Configurations can be exported and imported to easily share setups with others.
Data Aggregation: The console has built-in aggregation across the cluster showing each instance's values as individual data points in graphs. All metrics provide basic statistics like all time minimum, maximum, or average values that also can be added to graphs for reference.
Visual Thresholds: Users can also define thresholds as a visual reference line or to automatically highlight current values that escape a healthy range. This helps users identify a problematic status even with just a brief look at the page.
Page Rotation: When using the console on a TV screen to keep an eye on production systems, users can enable automatic page rotation so that each page is shown for a certain duration allowing an overview over all aspects of the server on a single screen. The included pages and the cycle duration are customisable as well.
User Defined Metrics: Metrics have all kinds of sources within the server including some that deployed applications can contribute to. For example, all MicroProfile Metrics defined via annotations will also be available in the monitoring console. This allows users to use the console to keep track of application level performance and status metrics.
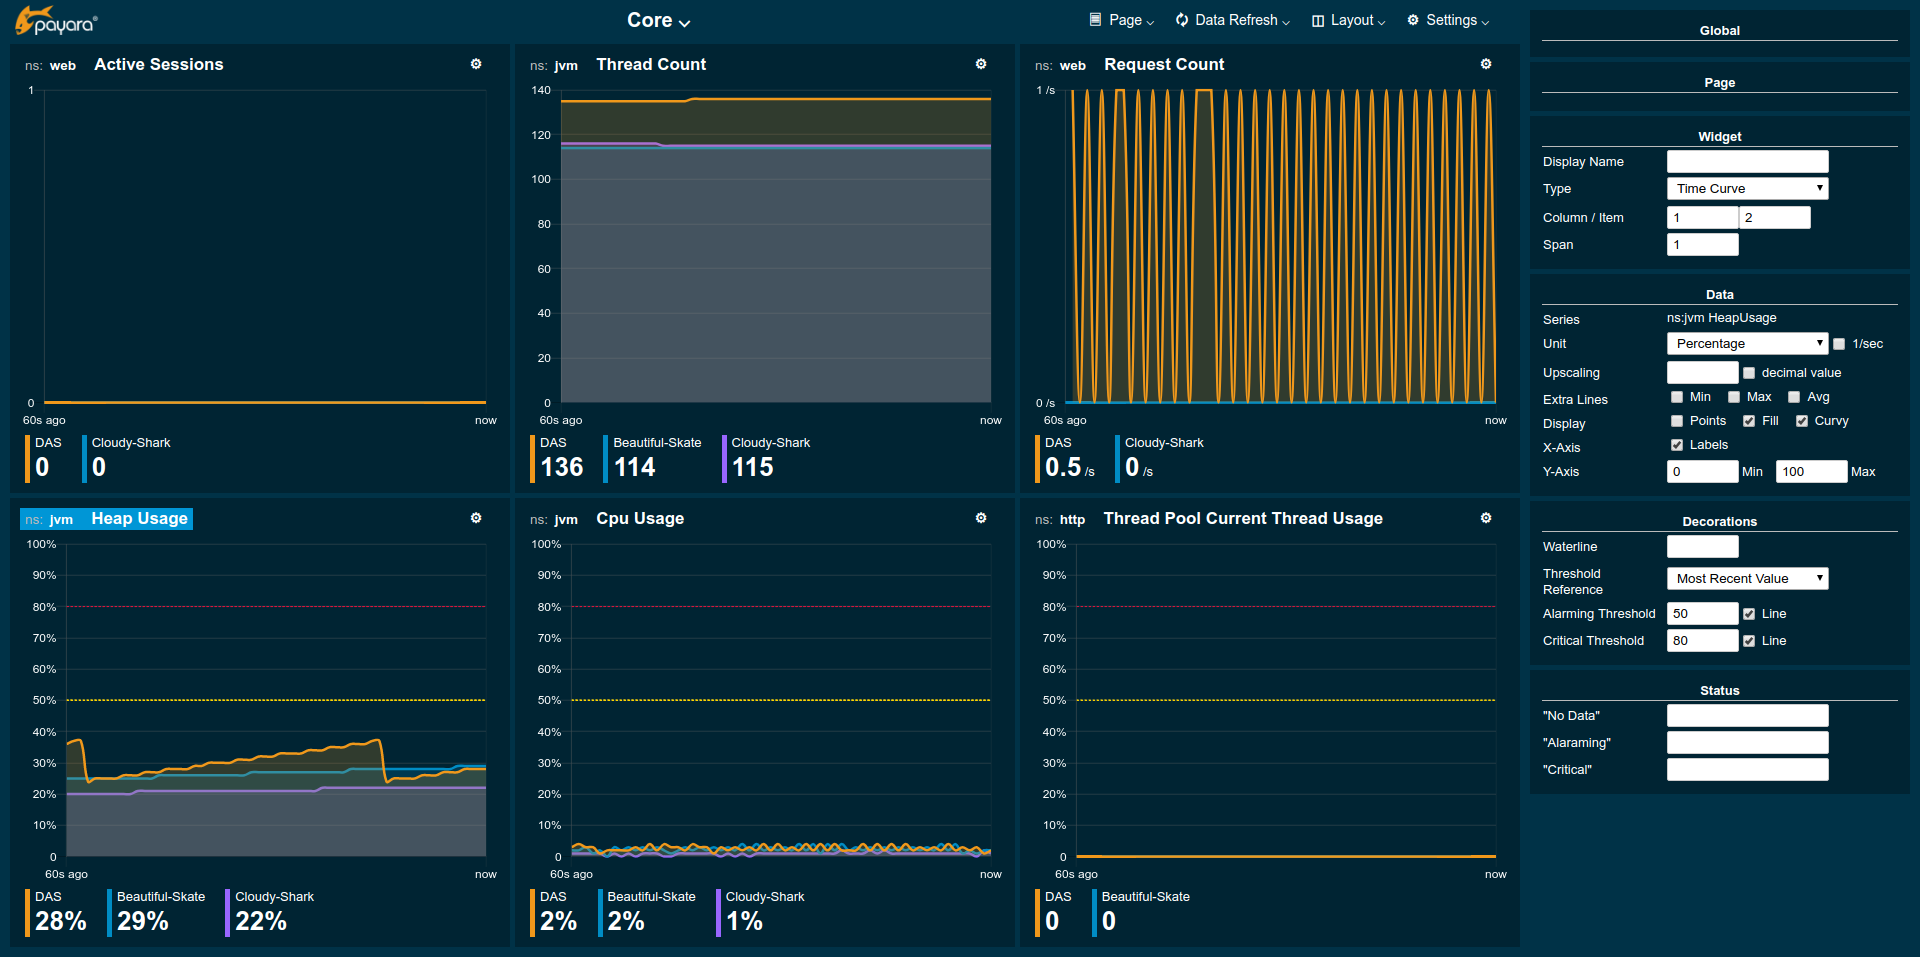
Image: Monitoring Console Core page with Settings for Selected Widget
Future Outlook
For the moment the console is limited to live data viewing where the last minute is shown in the graphs. We see this as the main use case but we also want to explore ways that allow analysing the past to gain more insight into what happened during certain events within the server.
Currently line graphs are the main type of widget. Other widgets, like data tables, or bar graphs might follow.
We're also thinking about how to integrate an alerting system that automates keeping an eye on certain metrics on behalf of the user, offering the user a list of violations to take a closer look at.
Of course we will also look into providing more useful metrics and predefined pages for the users in future releases.
A full user documentation for the monitoring console can be found as part of the server documentation. Please note that the documentation shown prior to 5.194 release will change quite a bit as the monitoring console was, and still is, a fast developing addition to the Payara Platform that we hope you will be as excited about as we are.
Click here to let us know how you're liking the monitoring console!

Try it Out! Download Payara Platform 5.194

Related Posts
What's New In The Payara Platform September 2025 Release?
Published on 03 Sep 2025
by Luqman Saeed
0 Comments

The September 2025 release marks a significant milestone with Payara 7.2025.1.Beta1 advancing Jakarta EE 11 readiness, alongside focused improvements across Payara Platform Community 6.2025.9, Enterprise 6.30.0, and Enterprise 5.79.0. This ...
The Payara Monthly Catch - August 2025
Published on 02 Sep 2025
by Dominika Tasarz
0 Comments

Welcome aboard the August 2025 issue of The Payara Monthly Catch! With summer in full swing, things may have felt a little more quiet across the Java world - but certainly not less interesting! We hope you managed to get some rest and recharge, ...