
Posts tagged diagnostics
Introducing Payara Platform Enterprise’s Diagnostics Tool: Streamlining Troubleshooting and Issue Resolution
Published on 13 Mar 2025
by Flavio Moreira
Topics:
Payara Server,
Payara Support,
Payara Enterprise,
diagnostics
|
0 Comments

If you rely on mission-critical applications for your business operations, making sure they run at all times is a must. However, issues can arise for a variety of reasons. In such situations, swift and efficient resolution is critical.
When issues arise in a complex server environment, effective troubleshooting is a cornerstone of delivering reliable, high-performing enterprise applications. That’s why we’re excited to introduce you to the Diagnostics Tool. This is an innovative data collection solution designed to improve troubleshooting, issue resolution and uptime for Jakarta EE applications running on Payara Platform Enterprise.
Ensuring Seamless Operations and Maximum Profitability: Key Insights on Application Server Efficiency and SLAs - Part 1
Published on 18 Jul 2024
by Chiara Civardi
Topics:
Ops Teams,
Upgrade,
DevOps,
Monitoring,
Developer,
Payara Support,
Migration,
diagnostics
|
0 Comments

Robust and efficient application servers are essential for companies relying on software applications, whether these support e-commerce platforms, financial services portals or internal operations. To help ensure smooth operations, deliver seamless services to users and generate revenue, it’s important that the runtime in place can offer maximum uptime to reduce cost while optimizing performance, profitability and user satisfaction.
In this blog post, we share insights from industry players on the impact of unexpected application server issues and downtime as well as how to reduce them.
Request Tracing in Payara Platform 5.192
Published on 15 Aug 2019
by Andrew Pielage
Topics:
JakartaEE,
Payara Platform 5,
diagnostics
|
1 Comment
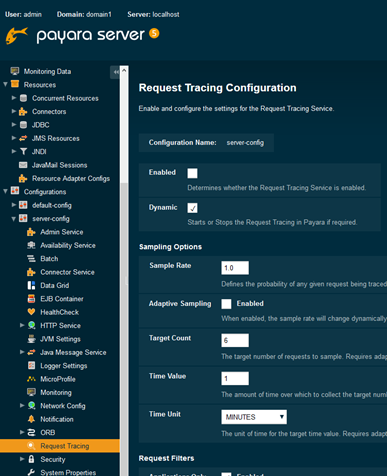
Request tracing has been a feature in Payara Platform for a number of years now, and over time it has evolved and changed in a number of ways. The crux of what the feature is remains the same, however: tracing requests through various parts of your applications and the Payara Platform to provide details about their travels.
Expanded Request Tracing Service in Payara Micro
Published on 21 Sep 2017
by Fabio Turizo
Topics:
What's New,
Payara Micro,
Microservices,
diagnostics,
request tracing
|
0 Comments
As previously reported on this blog, the Request Tracing Service was improved drastically in release 4.1.1.171 and implemented the configuration of a historic trace record storing for increased productivity purposes. In addition to these changes, we also made the configuration on the Request Tracing Service in Payara Micro for the same release. These changes to Payara Micro make it simpler to configure the Request Tracing Service when starting a new instance!
Payara Server 171 - Expanded Request Tracing
Published on 29 Mar 2017
by Ondro Mihályi
Topics:
What's New,
diagnostics,
request tracing
|
2 Comments

Since being introduced as a technical preview, the Request Tracing Service has been improved and polished to meet production quality requirements. In the latest Payara Server version 171, it was extended to allow tracing of more request types and more events that happen during the requests. It can also remember traces of the slowest 20 requests for viewing them later, though the number stored can be increased or decreased.
Request Tracing Service in Payara Server & Payara Micro
Published on 12 Sep 2016
by Ondro Mihályi
Topics:
What's New,
REST,
How-to,
Admin,
diagnostics,
request tracing,
Notifier
|
2 Comments
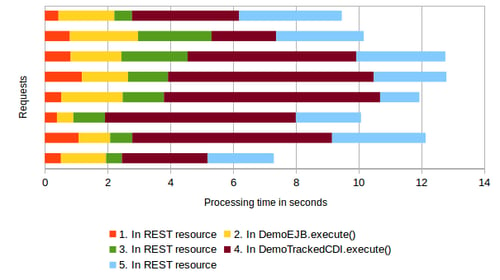
Have you ever wondered whether your application is slow to respond to requests? Which requests take the longest to respond to? And what you can do about it? Payara Server aims to provide the best tooling you would need to identify performance issues, identify their causes and help you solve them. One part of this tooling is the new Request Tracing service, available in Payara Server and Payara Micro from version 163 as a technical preview.