
Originally published on 29 Mar 2017
Last updated on 07 Jul 2021

Since being introduced as a technical preview, the Request Tracing Service has been improved and polished to meet production quality requirements. In the latest Payara Server version 171, it was extended to allow tracing of more request types and more events that happen during the requests. It can also remember traces of the slowest 20 requests for viewing them later, though the number stored can be increased or decreased.
With all that, the Request Tracing Service in Payara Server allows users to automatically monitor the requests processed by deployed applications and detect unusually long running requests, which most often indicates either a weak point in the application or some problem in the surrounding infrastructure.
To sum up, when request tracing is enabled, the following request types will be traced in Payara Server version 171:
- JAX-RS endpoint REST requests
- Servlet HTTP requests
- SOAP Web Service Requests
- Requests started by a WebSocket message
- Requests started by EJB timers
- Requests started by a JMS message handled by a message-driven bean
- Requests started by a JBatch job
- Requests started when a new task is executed in a managed executor
Once a request is being traced, the Request Tracing Service collects events during processing so that it may later provide a report of what was happening and how long it took.
Information is collected about the following events during the request:
- Start/end of the request
- An EJB method entered/exited
- A CDI bean method entered/exited (only configured methods are observed)
- SQL statement invocations via JDBC
- A JTA transaction is started/finished
- JASPIC authentication
When enabled, the Request Tracing service observes all the above events and records the timestamp, the time elapsed since the request started, authenticated user, as well as other information specific to each event type. For each EJB method invocation, for example, the name and the type of the EJB component, the name of the invoked method and whether the method was entered or finished are also recorded. If the configured threshold is exceeded by the running request, all this information is stored or processed by notifiers configured in the Notification Service. If the request completes within the threshold, the tracing information is ignored.
Once the Notification Service receives a notification about a long running request, it can print it into the server's log file (the default action), or use other notifiers to send the information outside Payara Server. With the historic trace feature enabled, it's also possible to retrieve tracing information about past requests directly from the Request Tracing Service, so that it's possible to view them instantly without searching for them in the server's log or messages from Notification Service notifiers.
Configuration of the Request Tracing Service
The configuration of request tracing hasn't been changed since the introduction of the Request Tracing Service in Payara Server 163.
To turn on request tracing, use the following asadmin command and specify required values for the threshold:
asadmin> requesttracing-configure --enabled=true --thresholdValue=5 --thresholdUnit=SECONDS --dynamic=true
The Request Tracing service would start and collect information about requests that run longer than the configured threshold value.
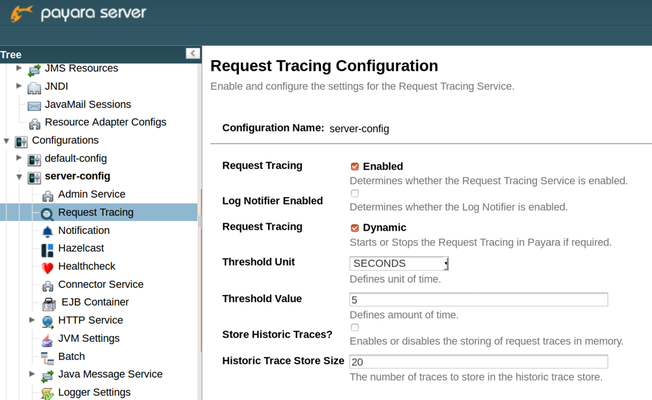
If you prefer using the Admin Console, you can enable and configure the Request Tracing service in the section Configurations → Request Tracing:
Accessing the information about long running requests
In order to access the collected information, we also need to configure at least one notifier to handle the information and send it to a file or external system, or turn on the historic traces feature so that we can later query for the information about latest requests that didn't meet the threshold. The historic traces feature works also without any notifier configured, therefore it is useful for testing the request tracing configuration and previewing the collected data, without trashing the Notification Service during the test.
Preview the data about long running requests
Once the Request Tracing Service is enabled and an application is deployed and processing requests, we can test the configuration by turning on the historic traces feature. Let's now do it and specify that at most 20 latest traces for long running requests should be preserved:
asadmin> requesttracing-configure --enabled=true --dynamic=true --historicaltraceenabled --historicaltracestoresize=20
It's possible to configure this in the Admin Console as well.
What's not yet possible to do in the Admin Console is to preview the preserved historical information about requests. For that, we need to resort to the asadmin command list-historic-requesttraces until the next Payara Server version. Assuming that one of the deployed applications generates requests that take longer than 5 seconds (this is the threshold we configured earlier when we enabled the service), the following command will list the information about 20 most recent requests that took longer than those 5 seconds:
asadmin> list-historic-requesttraces
The output of the above command could look like this:
Elapsed Time Traced Message
14033 {"RequestTrace": {"startTime":"297965703701277","elapsedTime":"14033",
"TraceEvent": {"eventType": "TRACE_START","eventName":"StartTrace","traceTime=":"0", ...
"TraceEvent": {"eventType": "REQUEST_EVENT","eventName":"RESTWSRequest","traceTime=":"1540029", "Method": "GET",...
"TraceEvent": {"eventType": "REQUEST_EVENT","eventName":"JTAContextBeginEvent","traceTime=":"911659985","Transaction ID": ...
"TraceEvent": {"eventType": "REQUEST_EVENT","eventName":"EJBMethod-ENTER","traceTime=":"911711836","EJBMethod": "execute","CallerPrincipal": "ANONYMOUS"...
"TraceEvent": {"eventType": "REQUEST_EVENT","eventName":"EJBMethod-EXIT","traceTime=":"2815598700","EJBMethod": "execute"...
"TraceEvent": {"eventType": "REQUEST_EVENT","eventName":"JTAContextEndEvent","traceTime=":"2815726656","Status": "Committed"...
"TraceEvent": {"eventType": "REQUEST_EVENT","eventName":"InterceptedCdiRequest-ENTER","traceTime=":"4759553250","MethodName": "execute"...
"TraceEvent": {"eventType": "REQUEST_EVENT","eventName":"InterceptedCdiRequest-EXIT","traceTime=":"12725759988","MethodName": "execute"...
"TraceEvent": {"eventType": "TRACE_END","eventName":"TraceEnd","traceTime=":"14033315265"...
Command list-historic-requesttraces executed successfully.
The output could contain up to historicaltracestoresize records (which is 20 in our case). We can limit the number of displayed records to show only the last one by providing an additional argument --first 1.
After we tested that the Request Tracing Service is configured properly and captures data about long requests, we can turn the historical traces feature off if we don't need it. In production, it is often useful to configure notifiers, such as the log notifier, so that information about all long-running requests is persisted and can be monitored and analyzed later.
Monitor the data about long running requests
We have configured the Request Tracing Service to monitor the requests and collect the information about those requests that took too long to complete. The Request Tracing Service sends the collected information to the Notification Service, which can be configured to process the notifications further. It is very common to enable the Log Notifier, which just prints the information to the server's log, which can then be monitored by external tools such as logstash, similar to the way we have shown in a previous blog.
We will now enable the Log Notifier in the Notification Service:
asadmin> set-notification-configuration --notifierEnabled=true --notifierDynamic=true --dynamic=true --enabled=true
We can also enable other notifiers in the Notification Service. There are many built-in notifiers available, e.g. the Email Notifier to send notifications to an email address, or the Slack notifier to send notifications to a Slack channel. If we need to implement a custom notification mechanism to send notifications to another external system, we can enable the JMS or the Event Bus notifier and process notifications received as either JMS messages or CDI remote events.
Because of a defect in Payara Server which was fixed in version 173, if you're using older versions of Payara Server, it is also required to turn on the Log Notifier on the Request Tracing Service so that the Log Notifier receives notifications from the Request Tracing Service. This can be done either via Admin Console in the Request Tracing screen, or using the set-requesttracing-configuration asadmin command with --notifierEnabled=true and --notifierDynamic=true.
This step is only required to enable the Log Notifier and is not necessary to enable any other notifier in the Notifications Service.

Related Posts
Introducing Payara Platform Enterprise’s Diagnostics Tool: Streamlining Troubleshooting and Issue Resolution
Published on 13 Mar 2025
by Flavio Moreira
0 Comments

If you rely on mission-critical applications for your business operations, making sure they run at all times is a must. However, issues can arise for a variety of reasons. In such situations, swift and efficient resolution is critical.
When ...
What’s New in the October 2024 Payara Platform Release?
Published on 09 Oct 2024
by Luqman Saeed
0 Comments

We're happy to announce the latest release of the Payara Platform, bringing significant improvements and updates across our Community and Enterprise editions (download Payara Enterprise trial here). This release focuses on enhancing security, ...