
Originally published on 15 Aug 2019
Last updated on 07 Jul 2021

Request tracing has been a feature in Payara Platform for a number of years now, and over time it has evolved and changed in a number of ways. The crux of what the feature is remains the same, however: tracing requests through various parts of your applications and the Payara Platform to provide details about their travels.
What Exactly Is Request Tracing?
Request Tracing is essentially application tracing – we call it request tracing because you’re tracing requests as they travel through your application.
What’s the Relationship with OpenTracing?
Our Request Tracing service pre-dates the inclusion of MicroProfile OpenTracing into the Payara Platform. Since the two were so closely related in function, we merged the two together, thus making our request tracing service an implementation of OpenTracing.
Use the MicroProfile Starter Beta tool to generate a MicroProfile Maven Project with Examples
Using Payara Micro:
When this merger happened, we adopted the terminology and structure used by OpenTracing, notably the concept of Spans; previously we referred to everything as a “trace” and had an event-based model. I’ll briefly cover the main parts here:
What’s a Span?
Paraphrasing the OpenTracing documentation: “A Span is a named, timed operation that represents an individual unit of work”. Since a Span is a unit of work, they typically contain references to other Spans. Formally, these references are one of two relationship types: “Follows From” or “Child Of”.
“Child Of” is a fairly self-explanatory relationship: one Span is directly a child of another. A simple example being a JAX-RS method calling a second JAX-RS method; the Span of the second JAX-RS method is a child of the Span of the first.
“Follows From” can be a little harder to get your head around, since in almost all cases the “follows from” Span is still invoked by a parent Span, so what makes it different? A simple rule of thumb is that if the parent Span doesn’t depend on the outcome of the child Span, then the child Span is a “follows from” Span.
Reusing our example from above and applying this logic to it, if the first JAX-RS method requires the outcome of the second JAX-RS method to finish, the Span of the second JAX-RS method has a “child of” relationship with the Span of the first. If instead the first JAX-RS method does not require the outcome of the second JAX-RS method to finish (e.g. if it simply just pokes it to kick off some other process), then the Span of the second JAX-RS method has a “follows from” relationship with the first.
If you're still a little shaky on the relationships, I recommend you read the actual OpenTracing specification section that defines them, as they describe and give some more examples for each.
What’s a Trace?
A Trace is the term used to describe the collection of Spans that make up an entire request’s lifecycle from the viewpoint of the Payara Platform: from the request hitting the server to it leaving. OpenTracing describes them as a "directed acyclic graph (DAG) of Spans, where the edges between Spans are called References". So while technically a Trace is a Span in its own right, within the Payara Platform we like to differentiate the two (plus “Trace” is arguably the more natural English word for what a Span is).
Unfortunately, “trace” is both a verb and a noun, so in our terminology you’ll see us talking about “tracing Spans”. Yay, English!
What Configuration Options Are There?
When confronted with all of the configuration options for Request Tracing, it can be a little intimidating, so I’ll cover each of them here. To start off with, Request Tracing is configured on a per-config basis, so you can have various servers with different Request Tracing configurations.
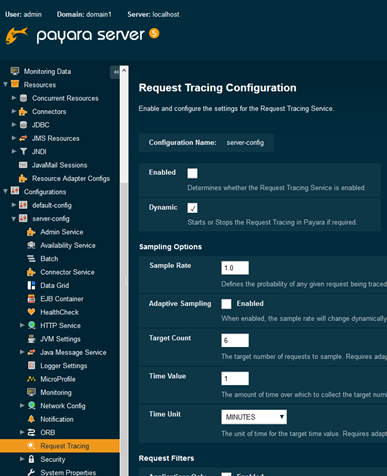
From the Admin Console, you can find it under: Configurations > config > Request Tracing. I’ll cover the asadmin command options as I discuss the various options, though the root command is set-requesttracing-configuration.
I’d be remiss if I didn’t mention the obvious quickly: make sure you enable the service!
asadmin set-requesttracing-configuration --enabled true --dynamic true
Sampling Options
This section is to do with the probability of tracing requests, and provides two mechanisms for defining this: “pure” percentage chance, and an adaptive option.
For “pure” percentage, the only option you need to be aware of is Sample Rate: this takes a decimal value between 0 and 1 to represent the percentage chance (a value of 1 means that all traces will be traced, and a value of 0 means nothing will be traced).
asadmin set-requesttracing-configuration --enabled true --dynamic true --samplerate 0.5 --dynamic true
For Adaptive Sampling, you have more options to tweak this to your liking: target count; time value; and time unit. Adaptive sampling attempts to dynamically alter the sample rate so that you get your target count number of traces over your configured time period. It should be stressed that the adaptive sampling option attempts to trace your desired number of requests over your configured time period – it will not always achieve this, as the solution does not simply just trace the first x requests that come in to hit the specified target.
asadmin set-requesttracing-configuration --enabled true --dynamic true --adaptivesampling true --adaptivesamplingtargetcount 6 --adaptivesamplingtimevalue 5 --adaptivesamplingtimeunit MINUTES
Request Filters
Even if you have the sample rate set to 100% (trace everything), by default very little would actually get traced; this is due to the filters. Filters are additional checks you can put in place to determine whether or not a Span is traced. By default, the Payara Platform will only trace requests that are sent to your application and that take longer than 30 seconds to complete.
Typically you only want to trace requests that go to your application, and aren’t interested in requests that ping the Server or Micro instance (particularly since most of these requests will be from the Payara Platform itself), but if you do wish to have these traced then make sure Applications Only is disabled.
The more commonly useful options are Threshold Value & Unit, and Sample Rate First. The former defines minimum time that a request must take to complete before being traced, allowing you to, for example, only have requests that take 500 milliseconds to complete be traced.
The latter option, Sample Rate First, allows you to specify whether the filters should be applied before or after sampling. When this is enabled (which it is by default), it means that whatever sampling option you have selected is run first to determine if a request should be traced, and then the filters are checked to decide if the request should still be traced. When disabled, the reverse is true, meaning that the filters are checked to see if a request should be traced, before then also checking against the sampling option.
For example, if you have a pure sample rate of 0.5 (50%), and a filter threshold of 2 seconds, with Sample Rate First enabled, the request tracing service will first essentially flip a coin to determine if the request should be traced, before then checking to see if it has a duration over 2 seconds. With Sample Rate First disabled, the request tracing service will first determine if the request’s duration is over 2 seconds before then flipping the coin.
While this may seem arbitrary at first glance, having Sample Rate First disabled actually increases the accuracy of your trace samples (at the cost of a small amount of overhead). This is achieved by the sample rate only being applied to traces that already match your filter criteria; when Sample Rate First is enabled requests are sampled before they are determined to be useful (passing your filters).
So if you have 100 requests coming in, a sample rate of 25%, and a filter of 2 seconds, with Sample Rate First enabled, you will get roughly 25 requests randomly being checked against your filters to see if they should be traced. Let’s say that only 2 of these 25 requests take over 2 seconds, but of the other 75 requests, let’s say that 50 of them took over 2 seconds – this means that you’ve got a very simple but not necessarily representative selection of two traces. In contrast, if you have Sample Rate First disabled, then only the requests that take over 2 seconds (which if you’re following along, is 52 requests), you will instead get a 25% sample of these 52 requests: roughly 13 traces.
Obviously, the scenario I just described was an extreme one, but depending on how accurate you wish your sample of traces to be you may wish to disable Sample Rate First. As mentioned though, this does incur a small performance overhead from simply determining if requests should be sampled as they leave your application rather than when they enter it.
asadmin set-requesttracing-configuration --enabled true --dynamic true --applicationsonlyenabled true --thresholdvalue 2 --thresholdunit SECONDS --sampleratefirstenabled true
Trace Store
The trace store is, simply, a store of traces. Assuming your instances have clustering enabled (which they do by default), they will share this trace store between themselves so that the results are representative of the domain rather than of each individual instance. By default, this store only keeps the 20 traces with the longest duration, but you can configure it to store a different number of traces, give the traces in the store a timeout (so that it’s a “true” rolling store), or enable Reservoir Sampling.
asadmin set-requesttracing-configuration --enabled true --dynamic true --tracestoresize 30 --tracestoretimeout 5m
When enabled, Reservoir Sampling changes the store from being a store of the longest traces, to instead one where the chance of a trace remaining in the store is constant, making it a rolling sample of your traces generally rather than a sample of just your longest traces. Since it doesn’t make sense to have a timeout with reservoir sampling, any timeout you have configured is ignored.
asadmin set-requesttracing-configuration --enabled true --dynamic true --tracestoresize 30 --reservoirsamplingenabled true
Historic Tracing Options
The historic trace store is a second, optional store that you can enable. The intention of this second store is to allow you to have a rolling store of your recent longest traces, and a more static store of your longest traces over the lifetime of the server. As such, it shares the same options as the “normal” trace store, allowing you to define the size and timeout of the store.
asadmin set-requesttracing-configuration --enabled true --dynamic true --historictracestoreenabled true --historictracestoresize 30 --historictracestoretimeout 30d
Although currently possible, it doesn’t make much sense to enable the historic request trace store when Reservoir Sampling is enabled since it enables it for both stores, meaning that you’d essentially just have two stores of potentially different sizes – I’m sure someone can think of a niche use for this though!
Just like with the rolling trace store, the historic store is shared across all instances when clustering is enabled.
Notifiers
The Notification Service is a beast in-and-of-itself, but I’ll briefly cover it here.
Rather than simply spitting out traces to a log file, they are instead sent to a selection of notifiers. For example, you can have the traces sent to the Log, Email, and Slack notifiers, which assuming you’ve enabled and configured them in the notification service itself, will then send the traces to your configured log file, Slack channel, and Email address.
By default, no notifier is selected for the request tracing service to send traces to, so typically you’ll likely want to enable the log notifier. If you don’t have any notifier selected however, the service will enable the log notifier by default.
To configure the notifiers for the Request Tracing service via asadmin, it's done like so (example shown configuring the log and jms notifiers):
requesttracing-log-notifier-configure --enabled=true --dynamic=true
requesttracing-jms-notifier-configure --enabled=true --dynamic=true
Configuration of the notifiers themselves (e.g. the Context Factory Class to use for the JMS notifier) is done using the notification-x-configure commands. For example, to make the log notifier print out to the default notification log file rather than the server.log file:
asadmin notification-log-configure --dynamic true --enabled true --useseparatelogfile true
How Do I Use it with Payara Micro Though?
Payara Micro doesn’t have an admin console or a CLI that you can run commands through to configure the service. What it does have however, is post-boot command files and a number of options that you can define from the command line as you start the instance:
--enablerequesttracing--enablerequesttracingadaptivesampling--requesttracingadaptivesamplingtargetcount--requesttracingadaptivesamplingtimeunit--requesttracingadaptivesamplingtimevalue--requesttracingthresholdunit--requesttracingthresholdvalue
The --enablerequesttracing option can optionally also be used to define the threshold unit and value to save you typing out those options like so:
java -jar payara-micro.jar --enablerequesttracing 5m
The keen eyed of you probably noticed that not all options are available from the Payara Micro startup options, in which case you’ll want to use the post-boot command option:
java -jar payara-micro.jar --postbootcommandfile /opt/micro/postbootcommands.txt
Simply fill out this file with asadmin commands as if you were running from the command line, like so:
set-requesttracing-configuration --enabled true --dynamic true
Don’t try and use the pre-boot command to enable request tracing – you’ll just get horrible errors!
What Does it Look Like?
Being as we're a MicroProfile OpenTracing implementation, the resultant output (particularly if you're outputting it to a log file) is JSON. It's unfortunately not formatted in a pretty way simply so as to not explode the log file with line breaks, though there are plenty of free tools available online that will make it pretty for you.
Log Output:
{"traceSpans":[
{"operationName":"processContainerRequest","spanContext":{"spanId":"0f41c789-b629-443f-97d5-5f753b6db8ee","traceId":"397ae067-134e-4c5c-8078-e754540e3ae3"},"startTime":"2019-07-24T14:32:58.234+01:00[Europe/London]","endTime":"2019-07-24T14:32:58.252+01:00[Europe/London]","traceDuration":"18000000","spanTags":[{"Server": "server"},{"Domain": "domain1"}]},
{"operationName":"processWebserviceRequest","spanContext":{"spanId":"817ecd12-eef0-4fe2-831e-ffb98fdd8e0e","traceId":"397ae067-134e-4c5c-8078-e754540e3ae3"},"startTime":"2019-07-24T14:32:58.234+01:00[Europe/London]","endTime":"2019-07-24T14:32:58.252+01:00[Europe/London]","traceDuration":"18000000","spanTags":[{"accept-language": "[en-GB,en;q=0.8,de;q=0.5,zh-CN;q=0.3]"},{"ResponseStatus": "200"},{"host": "[desktop-mbm7m49:8080]"},{"upgrade-insecure-requests": "[1]"},{"connection": "[keep-alive]"},{"Method": "GET"},{"URL": "http://desktop-mbm7m49:8080/opentracing-demo-1.0-SNAPSHOT/endpoint3"},{"accept-encoding": "[gzip, deflate]"},{"user-agent": "[Mozilla/5.0 (Windows NT 10.0; Win64; x64; rv:68.0) Gecko/20100101 Firefox/68.0]"},{"accept": "[text/html,application/xhtml+xml,application/xml;q=0.9,*/*;q=0.8]"}]},
{"operationName":"GET:fish.payara.blog.opentracing.JaxrsEndpoints.endpoint3","spanContext":{"spanId":"61d45405-00a6-4deb-a003-95f77fbe13d4","traceId":"397ae067-134e-4c5c-8078-e754540e3ae3"},"startTime":"2019-07-24T14:32:58.247+01:00[Europe/London]","endTime":"2019-07-24T14:32:58.250+01:00[Europe/London]","traceDuration":"3000000","spanTags":[{"component": "jaxrs"},{"span.kind": "server"},{"http.url": "http://desktop-mbm7m49:8080/opentracing-demo-1.0-SNAPSHOT/endpoint3"},{"http.method": "GET"}],"references":[{"spanContext":{"spanId":"0f41c789-b629-443f-97d5-5f753b6db8ee","traceId":"397ae067-134e-4c5c-8078-e754540e3ae3"},"relationshipType":"ChildOf"}]},
{"operationName":"fish.payara.blog.opentracing.AreYou.thirsty","spanContext":{"spanId":"7aedd13c-38e6-4e99-9364-4f882d75b165","traceId":"397ae067-134e-4c5c-8078-e754540e3ae3"},"startTime":"2019-07-24T14:32:58.250+01:00[Europe/London]","endTime":"2019-07-24T14:32:58.250+01:00[Europe/London]","traceDuration":"0","references":[{"spanContext":{"spanId":"61d45405-00a6-4deb-a003-95f77fbe13d4","traceId":"397ae067-134e-4c5c-8078-e754540e3ae3"},"relationshipType":"ChildOf"},{"spanContext":{"spanId":"0f41c789-b629-443f-97d5-5f753b6db8ee","traceId":"397ae067-134e-4c5c-8078-e754540e3ae3"},"relationshipType":"ChildOf"}]}
]}
Pretty:
{
  "traceSpans":[
    {
      "operationName":"processContainerRequest",
      "spanContext":{
        "spanId":"0f41c789-b629-443f-97d5-5f753b6db8ee",
        "traceId":"397ae067-134e-4c5c-8078-e754540e3ae3"

    },
      "startTime":"2019-07-24T14:32:58.234+01:00[Europe/London]",
      "endTime":"2019-07-24T14:32:58.252+01:00[Europe/London]",
      "traceDuration":"18000000",
      "spanTags":[
        {"Server": "server"},
        {"Domain": "domain1"}
      ]
    },
    {
      "operationName":"processWebserviceRequest",
      "spanContext":{
        "spanId":"817ecd12-eef0-4fe2-831e-ffb98fdd8e0e",
        "traceId":"397ae067-134e-4c5c-8078-e754540e3ae3"
      },
      "startTime":"2019-07-24T14:32:58.234+01:00[Europe/London]",
      "endTime":"2019-07-24T14:32:58.252+01:00[Europe/London]",
      "traceDuration":"18000000",
      "spanTags":[
        {"accept-language": "[en-GB,en;q=0.8,de;q=0.5,zh-CN;q=0.3]"},
        {"ResponseStatus": "200"},
        {"host": "[desktop-mbm7m49:8080]"},
        {"upgrade-insecure-requests": "[1]"},
        {"connection": "[keep-alive]"},
        {"Method": "GET"},
        {"URL": "http://desktop-mbm7m49:8080/opentracing-demo-1.0-SNAPSHOT/endpoint3"},
        {"accept-encoding": "[gzip, deflate]"},
        {"user-agent": "[Mozilla/5.0 (Windows NT 10.0; Win64; x64; rv:68.0) Gecko/20100101 Firefox/68.0]"},
        {"accept": "[text/html,application/xhtml+xml,application/xml;q=0.9,*/*;q=0.8]"}
      ]
    },
    {
      "operationName":"GET:fish.payara.blog.opentracing.JaxrsEndpoints.endpoint3",
      "spanContext":{
        "spanId":"61d45405-00a6-4deb-a003-95f77fbe13d4",
        "traceId":"397ae067-134e-4c5c-8078-e754540e3ae3"
      },
      "startTime":"2019-07-24T14:32:58.247+01:00[Europe/London]",
      "endTime":"2019-07-24T14:32:58.250+01:00[Europe/London]",
      "traceDuration":"3000000",
      "spanTags":[
        {"component": "jaxrs"},
        {"span.kind": "server"},
        {"http.url": "http://desktop-mbm7m49:8080/opentracing-demo-1.0-SNAPSHOT/endpoint3"},
        {"http.method": "GET"}
      ],
      "references":[
        {
          "spanContext":{
            "spanId":"0f41c789-b629-443f-97d5-5f753b6db8ee",
            "traceId":"397ae067-134e-4c5c-8078-e754540e3ae3"
          },
          "relationshipType":"ChildOf"
        }
      ]
    },
    {
      "operationName":"fish.payara.blog.opentracing.AreYou.thirsty",
      "spanContext":{
        "spanId":"7aedd13c-38e6-4e99-9364-4f882d75b165",
        "traceId":"397ae067-134e-4c5c-8078-e754540e3ae3"
      },
      "startTime":"2019-07-24T14:32:58.250+01:00[Europe/London]",
      "endTime":"2019-07-24T14:32:58.250+01:00[Europe/London]",
      "traceDuration":"0",
      "references":[
        {
          "spanContext":{
            "spanId":"61d45405-00a6-4deb-a003-95f77fbe13d4",
            "traceId":"397ae067-134e-4c5c-8078-e754540e3ae3"
          },
          "relationshipType":"ChildOf"
        },
        {
          "spanContext":{
            "spanId":"0f41c789-b629-443f-97d5-5f753b6db8ee",
            "traceId":"397ae067-134e-4c5c-8078-e754540e3ae3"
          },
          "relationshipType":"ChildOf"
        }
      ]
    }
  ]
}
I'll quickly cover some of the details of these Spans:
spanContext- Every single Span has a context, identifying it's own ID, and the ID of the trace to which it belongs.traceDuration- This is how long in (rounded) nanoseconds it took for the Span to completereferences- These are the parent Spanstags- These are key-value pairs containing info about the Span
What and How Can I Trace?
Tracing in Payara Platform is largely done either automatically, or via using the MicroProfile OpenTracing @Traced annotation. At its core it’s quite simple really, but when taken as a whole it becomes fairly complex.
The @Traced Annotation
This annotation is the crux of the tracing in Payara Platform. The core of its usage is defined by the MicroProfile OpenTracing spec, but I’ll cover how to use it here.
In a very short sentence, annotate the method that you wish to trace with the @Traced annotation, and voila! Any invocation of this method will now be traced. You can’t stick this annotation on absolutely any method and expect it to get traced however; the annotation is an Interceptor, so for the decorated methods of your CDI Beans to be traced they need to be a) not static or private, and b) accessed externally or via self-injection (you can't decorate this).
@RequestScoped
public class AreYou {

    @Traced
    public String thirsty() {
        return "Tea Guv'na?";
    }

}
@WebService(
    endpointInterface = "fish.payara.samples.jaxws.endpoint.servlet.JAXWSEndPointInterface",
    serviceName = "JAXWSEndPointImplementationService")
public class JAXWSEndPointImplementation implements JAXWSEndPointInterface {

    @Override
    @Traced(operationName = "customOperation")
    public String sayHi(String name) {
        return "Hi " + name;
    }

}
Assuming you’re using Maven, you can find this annotation in the following dependency:
<dependency>
    <groupId>org.eclipse.microprofile.opentracing</groupId>
    <artifactId>microprofile-opentracing-api</artifactId>
    <version>1.3.1</version>
    <scope>provided</scope>
</dependency>
You can also use this annotation to specify the operation name of the Span created when the method is invoked:
@GET
@Path("endpoint2")
@Traced(operationName = "greet")
public String endpoint2() {
    return "Good Morrow!";
}
As you can see from the example directly above (and from my previous statements in this blog), the @Traced annotation comes from MicroProfile OpenTracing and so can be used in a couple more places than just on JAX-WS and CDI Bean methods; you can also use the annotation on:
- JAX-RS Methods – These are traced automatically, but you can add the annotation to them if you want to change their name or disable tracing on them
- MicroProfile REST Client – Similar to JAX-RS methods, these are traced automatically, and you can use the annotation to change the operation name or disable tracing.
You can also, if you wish, annotate the class itself with the @Traced annotation – doing so will apply the annotation to all methods within the class to save you adding the annotation to all your methods individually. You can then individually annotate specific methods again if you don’t want them to be traced or want to change their operation name. In the following example, the hungry method would be traced, and the thirsty method would not.
@RequestScoped
@Traced
public class AreYou {

    @Traced(false)
    public String thirsty() {
        return "Tea Guv'na?";
    }

    public String hungry() {
        return "How ‘bout a biscuit?";
    }
}
It should also be noted that while you can, as previously mentioned, add the @Traced annotation to your JAX-WS methods, Payara Platform actually already traces the call to the WebService container automatically. Using the annotation however does still give you the ability to define the operation name, and you get some slightly different information (although you do unfortunately also get some duplication!).
Accessing the Tracer Directly
If you wish for some more finer grained control of your Spans, you can directly access the OpenTracing Tracer itself by injecting it:
@Inject
private Tracer tracer;
Once injected, you can manually start your own Spans, or add extra information to the currently active Span (typically the method that you’re already tracing). I’ve extended the previous example to demonstrate the latter here, which will add a tag to the Span started upon entrance into the JAX-RS method:
@GET
@Path("endpoint2")
@Traced(operationName = "greet")
public String endpoint2() {
    tracer.activeSpan().setTag("greeting", "whyHelloThere");
    return "Good Morrow!";
}
As a quick aside, a tag is just a key-value pair, and a log is a key-value pair with a timestamp.
And for a quick example showing how to create a Span that will close itself:
try (Span span = tracer.buildSpan("defineTime").startActive(true)) {
    // Wibbly-Wobbly Timey-Wimey Stuff
}
The Tracer class also gives you access to the inject and extract methods, which you can use for cross-process & thread propagation. The Payara Platform actually automatically does this for you if you're using a Managed Executor or a JAX-RS client.
The Tracer class can be found in the OpenTracing API dependency (not the MicroProfile one):
<dependency>
    <groupId>io.opentracing</groupId>
    <artifactId>opentracing-api</artifactId>
    <version>0.31.0</version>
    <scope>provided</scope>
</dependency>
Listening for Traces Using the CDI Event Bus
As previously mentioned during my explanation of how to configure the Request Tracing service, you can define various notifiers that the traces will be sent to as each one completes. For most this simply consists of the JSON representation of the trace, but for the CDI Event Bus we actually send an object down the line which you can programmatically inspect. Only traces that meet your filter criteria and that are being sampled are sent down the CDI Event Bus.
public void observe(@Observes @Inbound EventbusMessage event) {
    if (event.getData() instanceof RequestTracingNotificationData) {
        RequestTracingNotificationData notificationData = (RequestTracingNotificationData) event.getData();

        List<RequestTraceSpan> spans = notificationData.getRequestTrace().getTraceSpans();

        for (RequestTraceSpan span : spans) {
            span.getEventName();
        }

    }
}
As a quick explanation of what you’re seeing here:
RequestTracingNotificationDatais the implementation class of theNotificationDataclass, which is the base class for all CDI Event Bus notifications.getRequestTrace()retrieves the Trace. Remember from earlier that a Trace is what we refer to as the collection of Spans that cover an entire request.getTraceSpans()retrieves all of the Spans that make up the Trace. This list is likely what you’ll want to inspect in most circumstances.getEventName()retrieves the operation name of the Span. This method name is a holdover from our pre-OpenTracing days, when we used to refer to Spans as Events.
The dependency for these is the payara-api:
<dependency>
    <groupId>fish.payara.api</groupId>
    <artifactId>payara-api</artifactId>
    <version>5.192</version>
    <scope>provided</scope>
</dependency>
Once you’ve added this dependency, you can remove the io.opentracing dependency shown earlier if you’ve got it in your project, as payara-api has it as a transitive dependency (it has it as a dependency itself).
You can find the source for all of these classes so you can see the methods available on our GitHub here.
Automatic Tracing
Now, for all of the things that the Payara Platform traces automatically!
- JAX-RS Methods and Client calls (assuming you’re not using your own client class!)
- MicroProfile REST Client
- JAX-WS Method Invocations
- HTTP requests to Servlets – You can actually also trace the init and service methods of your servlets by adding the
@Tracedannotation to your Servlet class if your application uses CDI in some capacity - WebSockets
- EJB Timers Execution
- Inbound JMS messages received by an MDB
- Creation of JBatch Jobs
- Concurrent executions using the managed executor service
Skipping Automatic Tracing
You can again use the trusty @Traced annotation to disable tracing of automatic components like so:
@GET
@Path("endpoint3")
@Traced(value = false)
public String endpoint3() {
    return areYou.thirsty();
}
@WebServlet("/testServlet")
@Traced(false)
public class TestServlet extends HttpServlet {
For JAX-RS methods specifically, you can also define a skip pattern using MicroProfile Config (so using a properties file, or another config source) as defined by the OpenTracing spec here.
The Future of Payara Platform Request Tracing
Although a bit of a monster blog, I hope you find it helpful in instructing you on the various aspects of the request tracing system within Payara Platform. We’ll be updating our documentation with a bevy of information around Request Tracing soon, and I’ll be raising a couple of issues internally since I’ve spotted a few areas where the usability of the service could be improved! This in-turn may lead to further enhancements, but who knows which way the winds of fate will blow…
If you have any questions, as always feel free to contact us via our usual channels: comments, Twitter, Facebook, Forum, GitHub, or Email.
Related Posts
The Payara Monthly Catch - March 2025
Published on 31 Mar 2025
by Nastasija Trajanova
0 Comments

March was quite eventful indeed! ✨ This month, our Payarans were on the move — bringing their energy, insights, and expertise to not one, but two major Java conferences: Devnexus and JavaOne. With expert-led talks, exciting conversations at ...
Introducing Payara Platform Enterprise’s Diagnostics Tool: Streamlining Troubleshooting and Issue Resolution
Published on 13 Mar 2025
by Flavio Moreira
0 Comments

If you rely on mission-critical applications for your business operations, making sure they run at all times is a must. However, issues can arise for a variety of reasons. In such situations, swift and efficient resolution is critical.
When ...