New Relic and DataDog notifiers for Payara Server
Published on 14 Mar 2018
by Fabio Turizo
Topics:
How-to,
Cloud-native,
Notifier
|
0 Comments
As part of release 4.1.2.173, new notifier integrations were developed for Payara Server for the New Relic and DataDog application performance monitoring (APM) services. Both services allow the gathering of JVM statistics, HTTP metrics and support the use of notification for critical events in the server lifecycle management. In this era of cloud services, performance monitoring is an integral part of the IT infrastructure for any organization, which is the reason integration with these services has been brought to Payara Server. This article will show how to correctly set up these notifiers to that purpose.
Improvements to SQL Logging in Payara Server 173
Published on 13 Oct 2017
by Fabio Turizo
Topics:
What's New,
How-to
|
0 Comments
A crucial component in many web applications is the use of a database. The chances of using JDBC directly or indirectly to access a relational database (through JPA or other ORM frameworks) on these applications are quite high. A common problem when dealing with relational databases is dealing with SQL queries or statements that take too much time to resolve, thus causing your application to be considered slow in producing results to the user. It's usually better to detect these issues preemptively, before sub-par performance damages your application, and Payara Server has you covered!
New Arquillian Container for Payara Server
Published on 03 Oct 2017
by Fabio Turizo
Topics:
What's New,
Java EE,
Arquillian
|
5 Comments
One of the core steps in every continuous integration process is running integration tests for your application. Unlike vanilla unit tests, integration tests allow you to assess the state of your applications or systems by testing all of its components together (modules, databases, messaging, etc.) and verifying that they work correctly as a whole unit. Needless to say, integration tests are more complex that simple unit tests, have a larger footprint, take more time and are usually saved to test full releases or major changes to implementations.
Expanded Request Tracing Service in Payara Micro
Published on 21 Sep 2017
by Fabio Turizo
Topics:
What's New,
Payara Micro,
Microservices,
diagnostics,
request tracing
|
0 Comments
As previously reported on this blog, the Request Tracing Service was improved drastically in release 4.1.1.171 and implemented the configuration of a historic trace record storing for increased productivity purposes. In addition to these changes, we also made the configuration on the Request Tracing Service in Payara Micro for the same release. These changes to Payara Micro make it simpler to configure the Request Tracing Service when starting a new instance!
Security Auditing in Payara Server - Part 2
Published on 14 Jul 2017
by Fabio Turizo
Topics:
How-to,
Security,
JVM,
EJB
|
0 Comments
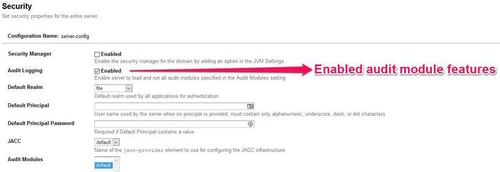
Following up from the first part of the Security Auditing article, where we covered the audit logging, in this part we will focus on creating a custom audit module.
Security Auditing in Payara Server - Part 1
Published on 06 Jul 2017
by Fabio Turizo
Topics:
How-to,
Security,
JVM,
EJB
|
0 Comments
Security is always a concern you must have when implementing applications that will run in production environments. Both the JVM and Payara Server have a strong tool set of security implementations for most use cases in the industry, so you won’t have to worry about implementing your own security measures from scratch.
GlassFish to Payara Server Migration - Migrating Away From the Performance Tuner
Published on 21 Mar 2017
by Fabio Turizo
Topics:
How-to,
GlassFish Migration
|
0 Comments
In the last part of our series on migrating away from Oracle GlassFish Server, we will look at replacing the functionality of the Performance Tuner.
What's new in Payara Micro 171?
Published on 23 Feb 2017
by Fabio Turizo
Topics:
What's New,
Payara Micro,
Microservices,
Hazelcast,
Caching,
Admin,
Cloud,
MicroProfile
|
2 Comments
In case you missed the news earlier this week - we are pleased to announce a new release of Payara Micro and Payara MicroProfile 171 to start the new year with a bang! With this new release, we have implemented substantial changes that are meant to improve the stability and usability of both 'regular' and MicroProfile version of Payara Micro. As is usual with our releases, keep special attention to our blog in the following weeks to read detailed articles on these changes and features to take full advantage of them!
For Payara support customers, LTS - Long Term Support - has been introduced for both Payara Micro and Payara MicroProfile so you can expect a full year of patch releases which only include fixes - great news for users who value stability over new features (find out more about the support services here)!
All new changes and features introduced in this release are also included in Payara MicroProfile unless explicitly stated.
GlassFish to Payara Server Migration - migrating away from the Oracle Access Manager integration
Published on 09 Feb 2017
by Fabio Turizo
Topics:
How-to,
Security,
JASPIC,
GlassFish Migration
|
0 Comments
In the fifth part of our continuing series on alternatives for commercial Oracle GlassFish features, we are looking at a replacement for the Oracle's Access Manager integration feature.
GlassFish to Payara Server Migration: Replacing the Monitoring Scripting Client
Published on 25 Jan 2017
by Fabio Turizo
Topics:
Healthcheck,
Monitoring,
JMX,
GlassFish Migration
|
0 Comments
In the fourth part of our continuing series on alternatives for commercial Oracle GlassFish features we are looking at the JMX Monitoring Service & the Payara HealthCheck Service as possible replacements for Oracle's Monitoring Scripting Client.


