
Originally published on 14 Mar 2018
Last updated on 16 Jul 2021

As part of release 4.1.2.173, new notifier integrations were developed for Payara Server for the New Relic and DataDog application performance monitoring (APM) services. Both services allow the gathering of JVM statistics, HTTP metrics and support the use of notification for critical events in the server lifecycle management. In this era of cloud services, performance monitoring is an integral part of the IT infrastructure for any organization, which is the reason integration with these services has been brought to Payara Server. This article will show how to correctly set up these notifiers to that purpose.
New Relic Notifier Setup
The notifier for the New Relic service uses access to the Insights service via remote API calls. This means that all custom event notifications generated by Payara Server will be gathered in the Data Explorer under different categories for the relevant internal services that report notification events (like those generated from the Health check or Request Tracing services). To do this, a Java agent must be installed in Payara Server so that it can report data back to the Insights service.
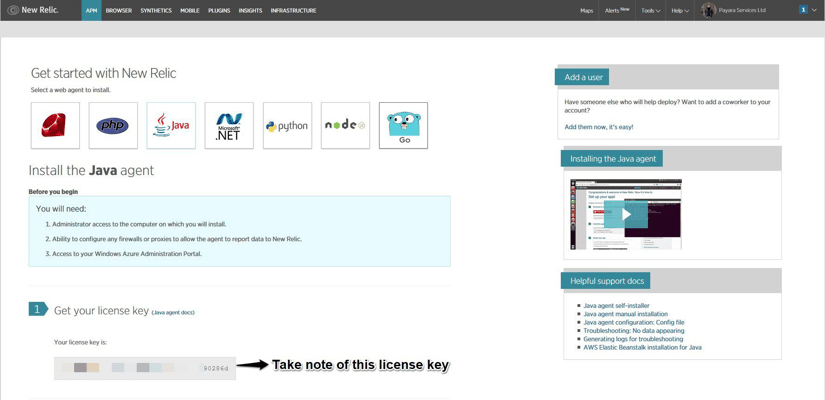
To install the Java agent, a New Relic account must be created first (free-trial accounts are available for evaluation purposes and are active for 14 days). After signing up for the service, a "Getting Started" screen will welcome new users:
![agent-setup-1[1].png](https://blog.payara.fish/hs-fs/hubfs/New%20Relic%20and%20DataDog%20notifiers%20for%20Payara%20Server%20blog%20images/agent-setup-1%5B1%5D.png?width=825&height=400&name=agent-setup-1%5B1%5D.png)
Selecting the Java option will give details on the instructions on how to proceed with the installation, and will also let you retrieve a license key that will be used to configure the Java agent:
Proceed to download the Java agent from this screen and copy the resulting file (a ZIP archive) to the server which houses the Payara Server installation. To be precise, the agent needs to be installed only in the server which houses the DAS installation, something that you need to have in mind if you have a distributed environment. Once the Java agent has been copied to this machine, unzip the bundle and copy the resulting folder to the domain directory of the Payara Server domain you wish to monitor:
unzip newrelic-java-3.XX.X.zip
mv newrelic ${PAYARA_INSTALL_DIR}/glassfish/domains/<DOMAIN_DIR>
The next step is to prepare the agent's configuration before running the installer. Edit the newrelic.yml configuration file located inside the folder we just copied to the domain's directory, and set the license key using the license_key property:
# ...
# This section is for settings common to all environments.
# Do not add anything above this next line.
common: &default_settings

  # ============================== LICENSE KEY ===============================
  # You must specify the license key associated with your New Relic
  # account. ...
  license_key: 'XXXXXXXXXXXXXXXXXXXXXXXXXXXXXXXXXXXXX90286d'

  # Agent Enabled
  # Use this setting to disable the agent instead of removing it from the startup command.
  # Default is true.
  agent_enabled: true

  # Set the name of your application as you'd like it show up in New Relic.
  # ...
  app_name: Payara Server 4.1.2.174 (Remote Server #1)
It is recommended to also set the app_name property to help you identify the server installation among other Payara Server instances that will share the New Relic Insight dashboard.
Having done this, proceed to install the Java agent with the following command:
java -jar newrelic/newrelic.jar install
Which will prompt an output similar to the following to confirm the installation's success:
***** ( ( o)) New Relic Java Agent Installer
***** Installing version 3.XX.X ...
* Backed up start script to /opt/payara-4.1.2.174/glassfish/domains/payaradomain/config/domain.xml.20180201_100000
* Added agent switch to start script /opt/payara-4.1.2.174/glassfish/domains/payaradomain/config/domain.xml
* No need to create New Relic configuration file because: A config file already exists: /opt/payara-4.1.2.174/glassfish/domains/payaradomain/newrelic/newrelic.yml

***** Install successful
***** Next steps:
You're almost done! To see performance data for your app:
1) Restart your app server
2) Exercise your app
3) Log into http://rpm.newrelic.com

Within two minutes, your app should show up, ready to monitor and troubleshoot. If app data doesn't appear, check newrelic/logs/newrelic_agent.log for errors.ar install
You can confirm that the server is being monitored by New Relic if you see the following messages when starting the respective domain:
INFO: New Relic Agent: Loading configuration file "/opt/payara-4.1.2.174/glassfish/domains/payaradomain/newrelic/newrelic.yml"
INFO: New Relic Agent: Writing to log file: /opt/payara-4.1.2.174/glassfish/domains/payaradomain/newrelic/logs/newrelic_agent.log
Now that we have our agent installed, we need to configure the New Relic notifier. To properly configure it, we need to retrieve special tokens from the Insights service. Head to the Insights dashboard, and go the Manage Data option located at the side menu:
![insights-api-keys-screen[1].png](https://blog.payara.fish/hs-fs/hubfs/New%20Relic%20and%20DataDog%20notifiers%20for%20Payara%20Server%20blog%20images/insights-api-keys-screen%5B1%5D.png?width=825&height=375&name=insights-api-keys-screen%5B1%5D.png)
From there, click on the plus icon at the side Insert Keys section to create a new API Key which will be used by the notifier to talk to the Insight Service. The newly created key will be composed of 2 tokens, Account ID and Key:
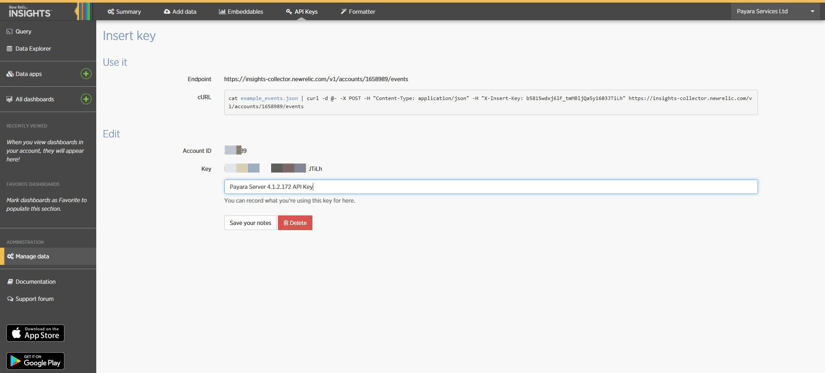
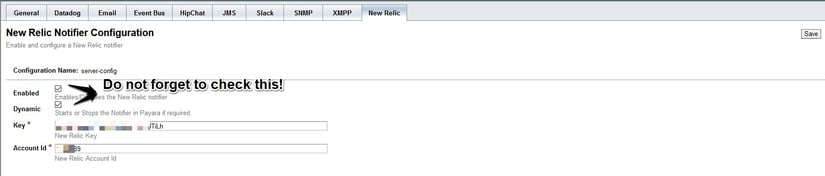
Take note of these tokens since we will input them immediately to configure the notifier. In order to do this we will use the Web Admin Console, so head to the Configuration → [instance-configuration] → Notification Service section in the side menu and select the New Relic notifier. Now, you only need to enable the notifier and input the tokens:
And there you go! With this the notifier is configured and you may browse through the notification events in the Insights dashboard like this:
![insights-data-explorer-results[1].png](https://blog.payara.fish/hs-fs/hubfs/insights-data-explorer-results%5B1%5D.png?width=825&height=317&name=insights-data-explorer-results%5B1%5D.png)
DataDog Notifier Setup
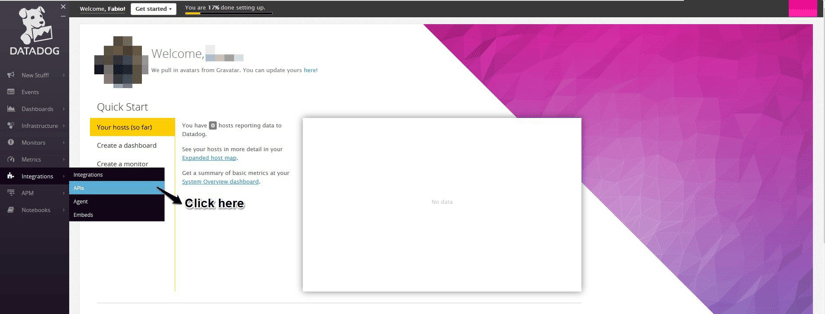
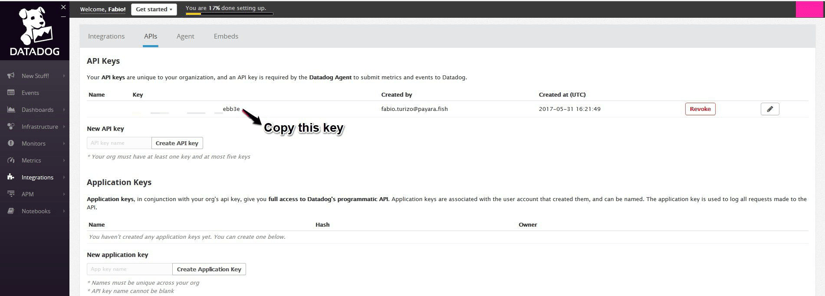
The notifier for the DataDog service uses the service remote API to gather all notification events in its dashboard. The integration configuration is simpler since only an API key is needed to let the notifier talk to the DataDog service. You will need to create a DataDog account (a 14-day free trial is available for new users like with New Relic), and then head to the https://app.datadoghq.com/ URL, and access the Integrations → APIs option:
Afterwards, retrieve the default API Key from the user interface. You can also create a new key if you need to separate other servers or services from Payara Server or to differentiate between multiple Payara Server instances:
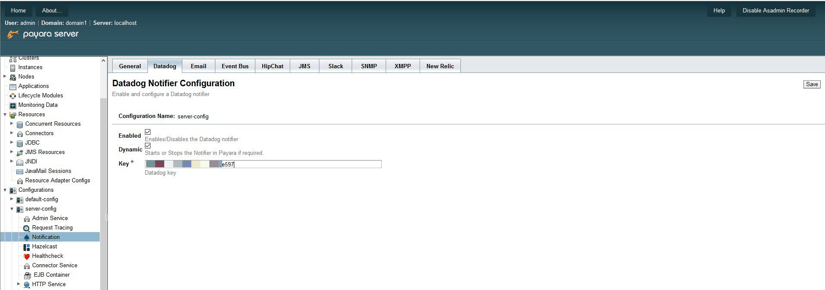
To configure the notifier, we will also use the Web Admin Console, so head to the Configuration → [instance-configuration] → Notification Service section in the side menu and select the DataDog notifier. Now, you only need to enable the notifier and input the API Key:
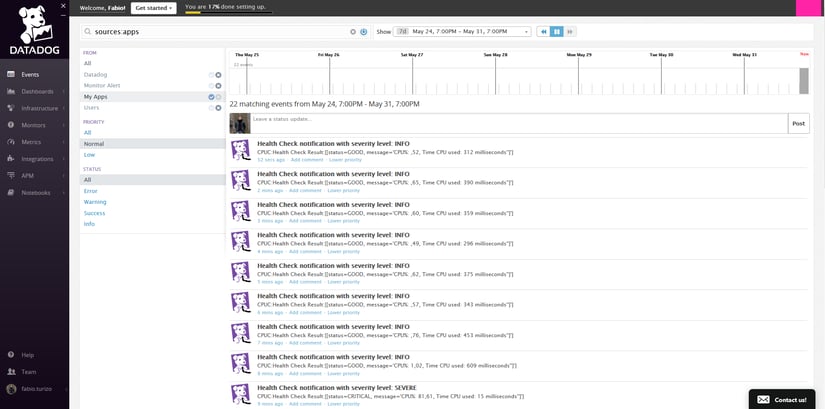
And with this we're all set! Notification events will be shown in the Events view for the Datadog's dashboard. There you can explore them at you leisure:
Summary
As you can gather from this short article, configuring these notifiers for APM tools and services is pretty simple. This is an added benefit for all Payara Server users that need to integrate existing monitoring solutions into their infrastructure. The list of these notifiers will keep growing, so any feedback or suggestions you can give us will help!
Related Posts
How to Build Cost-Effective Cloud Architectures
Published on 19 Aug 2025
by Chiara Civardi
0 Comments

Cloud adoption has transformed how developers build and scale applications, but it also brings new challenges in controlling costs. As cloud bills grow alongside usage, designing cost-efficient cloud architectures becomes essential for ...
What Is a Cloud Server? Types, Benefits, and Use Cases
Published on 29 Jul 2025
by Valentina Kovacic
0 Comments

Cloud computing has transformed how enterprises deploy and manage applications. A cloud server provides an on-demand, scalable infrastructure that enables businesses to launch services without heavy upfront investments in hardware. Whether used ...