
Posts tagged Payara Server Basics (4)
Payara Server Basics Part 1 - Installing Apache on Ubuntu
Published on 02 Feb 2017
by Michael Ranaldo
Topics:
Payara Server Basics,
Apache,
Ubuntu,
Payara Server Basics - Series
|
2 Comments

In this blog series, we will aim to give an overview of the basics of using Payara Server in a production scenario using Apache Web Server (sometimes called httpd) and Ubuntu 16.04. Many of the concepts described in these blogs do not rely on the tools we are using here and can be applied to other scenarios.
Fundamentos de Payara Server Parte 1 - Instalando Apache en Ubuntu
Published on 02 Feb 2017
by Michael Ranaldo
Topics:
Payara Server Basics,
Apache,
Ubuntu,
Payara Server Basics - Series
|
0 Comments
Getting Started with the Payara Micro API - Demo
Published on 18 Jan 2017
by Andrew Pielage
Topics:
Maven,
Payara Micro,
Microservices,
Demo,
Payara Server Basics,
NetBeans,
Admin
|
0 Comments
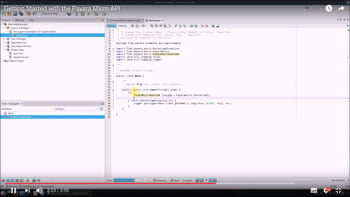
As a follow up to our 'Getting Started with Payara Micro Demo', we have another introductory video for you, this time demonstrating the Payara Micro API, using NetBeans and Maven.
Getting Started with Payara Micro - Demo
Published on 28 Dec 2016
by Andrew Pielage
Topics:
Payara Micro,
Microservices,
Demo,
Payara Server Basics,
How-to
|
1 Comment

In this short introductory demo we will show you how to start Payara Micro and demonstrate how simple it is to use its dynamic clustering feature.
Making Use of Payara Server's Monitoring Service - Part 3: Using Kibana to Visualise the Data
Published on 25 Aug 2016
by Fraser Savage
Topics:
What's New,
Payara Server Basics,
How-to
|
0 Comments

When Payara Server has been logging monitoring data to the server log for a short while, the metrics that Logstash outputs to Elasticsearch can be visualised using Kibana. In this blog post, we will create a date histogram displaying used heap memory as a percentage of the maximum heap memory.


Making Use of Payara Server's Monitoring Service - Part 2: Integrating with Logstash and Elasticsearch
Published on 24 Aug 2016
by Fraser Savage
Topics:
What's New,
Payara Server Basics,
How-to
|
1 Comment

Following the first part of this series of blog posts, you should now have a Payara Server installation which monitors the HeapMemoryUsage MBean and logs the used, max, init and committed values to the server.log file. As mentioned in the introduction of the previous post, the Monitoring Service logs metrics in a way which allows for fairly hassle-free integration with tools such as Logstash and fluentd.
Often, you might find it useful to store your monitoring data in a search engine such as Elasticsearch or a time series database such as InfluxDB. One way of getting the monitoring data from your server.log into one of these datastores is to use Logstash.
This blog post covers how to get monitoring data from your server.log file and store it in Elasticsearch using Logstash.
Making Use of Payara Server's Monitoring Service - Part 1: Setting up the Service
Published on 23 Aug 2016
by Fraser Savage
Topics:
What's New,
Payara Server Basics,
How-to
|
3 Comments

(note: there is an updated version of this blog post available here https://blog.payara.fish/making-use-of-payara-servers-jmx-monitoring-service-part-1-setting-up-the-service)
With the release of version 4.1.1.163, Payara Server includes a JMX Monitoring Service (technical preview) which can be used to log information from MBeans to the server log. Using the Monitoring Service, you can monitor information about the JVM runtime such as heap memory usage and threading, as well as more detailed information about the running Payara Server instance. The information is logged as a series of key-value pairs prefixed with the string PAYARA-MONITORING:, making it easy to filter the output using tools such as Logstash or fluentd.
In this blog series we're going to show you exactly how to use the new Payara Server Monitoring Service. First, we'll take a look at setting up the service - let's get started!
Running Payara Server on the Zulu JVM
Published on 28 Apr 2016
by Susan Rai
Topics:
Payara Server Basics,
How-to,
GlassFish basics,
JVM
|
0 Comments

In this quick blog I will explain how you can install Zulu JVM and run Payara Server on it. I will be using Ubuntu 14.04 LTS but it shouldn’t require many modifications in case you prefer using other Linux-based platforms.
Ejecutando Payara Server en una JVM Zulu
Published on 28 Apr 2016
by Susan Rai
Topics:
Payara Server Basics,
How-to,
GlassFish basics,
JVM,
Spanish language
|
0 Comments
En este pequeño blog voy a explicar como puedes instalar la JVM (Java Virtual Machine) Zulu y ejecutar Payara Server en ella. Para esta demostración voy a utilizar Ubuntu 14.04 LTS, pero en caso de que prefieras usar otras plataformas basadas en Linux, no se requieren muchas modificaciones.
Crear un Servicio Web RestFul con Payara Server y NetBeans
Published on 17 Mar 2016
by Steve Millidge
Topics:
Payara Server Basics,
How-to,
NetBeans,
Spanish language
|
0 Comments
Payara Server y NetBeans son perfectos para crear servicios web RESTFul y aplicaciones web!
See here for the original version in English language.
En este corto video, voy a mostraros como de fácil es crear un servicio web RESTFul utilizando Payara Server con NetBeans.