
Originally published on 28 Nov 2018
Last updated on 05 Jun 2019

(This is an update of this blog written in 2016: Making Use of Payara Server's Monitoring Service)
Payara Server has for a while now included a JMX Monitoring Service which can be used to log information from MBeans to the server log. Using the JMX Monitoring Service, you can monitor information about the JVM runtime such as heap memory usage and threading, as well as more detailed information about the running Payara Server instance. The information is logged as a series of key-value pairs prefixed with the string PAYARA-MONITORING:, making it easy to filter the output using tools such as Logstash or fluentd.
In this blog series we're going to show you how to use the JMX Monitoring Service. First, we'll look at setting up the service - let's get started!
As a point of clarification, Monitoring Service is the term used to refer to the overarching service that governs monitoring; the JMX Monitoring Service is a related component service of this but is configured separately.
Configuring the JMX Monitoring Service
The JMX Monitoring Service is disabled by default, so it must be configured to get some metrics. A convenient way to configure the JMX Monitoring Service is with the new asadmin command set-jmx-monitoring-configuration.
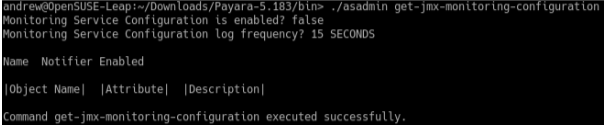
To view the current monitoring configuration there is the get-jmx-monitoring-configuration asadmin command. The service configuration is displayed first, followed by a table of MBean attributes that are being monitored.
Calling the get-jmx-monitoring-configuration command should show the following for the default configuration:
Configuration Options
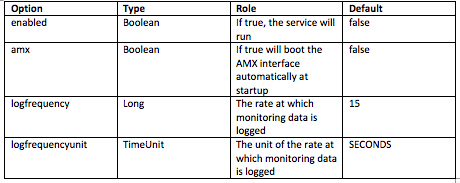
The JMX Monitoring Service has four configuration options, each of which have their own default values:
Alongside these options, the configuration accepts properties which represent the MBean attributes to monitor. Each attribute must have an attributeName, an objectName, and can optionally have a description to denote the MBean Attribute, the MBean ObjectName, and extra information that is printed as part of the get-jmx-monitoring-configuration asadmin command respectively. An example attribute might have the following:
attributeName="HeapMemoryUsage" objectName="java.lang:type=Memory" description="JVM_Heap_Usage"
Configuring the Service Using Asadmin
Adding Attributes
To add an attribute to monitor you can use the --addattribute option of set-jmx-monitoring-configuration. This option takes a string wrapped in single quote marks (' '), containing space delimited key-value pairs. An example of adding an attribute is:
asadmin set-jmx-monitoring-configuration --addattribute 'attributeName=HeapMemoryUsage objectName=java.lang:type=Memory'
After running the above command, the get-jmx-monitoring-configuration command will show something like this:
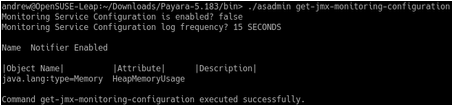
Note: The HeapMemoryUsage MBean attribute is composite, with multiple values stored within it. This means that by only providing attributeName=HeapMemoryUsage the JMX Monitoring Service will log all values stored in the attribute. As HeapMemoryUsage has values of committed, init, max, and used, these would all be included in the log message. If you wished to log just the value for used, then you could provide an attributeName of HeapMemoryUsage.used.
In general, if an attribute is composite, providing attributeName={$MBEANATTRIBUTE}.{$VALUE} will cause the JMX Monitoring Service to attempt to extract the value when logging. In the previous example $MBEANATTRIBUTE would be HeapMemoryUsage and the $VALUE is used.
Deleting Attributes
If you no longer wish to monitor an attribute or gave an invalid one, there is a --delAttribute option available. To remove an attribute from the JMX Monitoring Service, use the attributeName of the MBean:
asadmin set-jmx-monitoring-configuration --delAttribute HeapMemoryUsage
This will entirely remove the attribute from the JMX Monitoring Service's configuration so, if the attribute needs to be re-added in future, it must be re-added in full.
Enabling the JMX Monitoring Service
With an attribute added, we will now get more useful output from the service if we enable it.
The JMX Monitoring Service configuration can be either be reloaded dynamically, or on next start-up, with the set-jmx-monitoring-configuration asadmin command. For dynamic reloading, set-jmx-monitoring-configuration provides a --dynamic option. Setting it to true (which it is by default) will cause the service to stop logging with the previous configuration and then start logging with the new configuration without needing a restart.
So, to reload the configuration dynamically on the currently running server instance:
Asadmin set-jmx-monitoring-configuration --dynamic true --enabled true
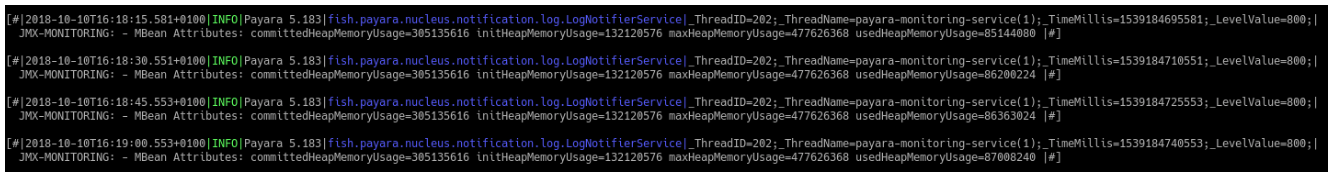
The command result can be seen below:

The service should then start monitoring to the server.log file:
Configuring the Service Using the Administration Console
As an alternative to using asadmin, the JMX Monitoring Service can also be configured in much the same way using the administration console. This particular configuration page can be found on the JMX tab under the Configurations > server-config > Monitoring page.
See Part 2: Integrating with Logstash and Elasticsearch
See Part 3: Using Kibana to Visualise the Data
Related Posts
Join Live Webinar Series - Boost Your System Performance: Troubleshoot Faster & Cut GC Waste
Published on 07 Oct 2024
by Dominika Tasarz
0 Comments

We’re excited to invite you to two informative webinars happening later this month, which we're running in collaboration with yCrash.
During the first webinar, you will learn how to capture 16 essential artifacts that can dramatically ...
Ensuring Seamless Operations and Maximum Profitability: Key Insights on Application Server Efficiency and SLAs - Part 2
Published on 12 Aug 2024
by Chiara Civardi
0 Comments

Robust and efficient application servers are crucial for companies relying on software applications, whether supporting e-commerce platforms, financial services portals, or internal operations. To ensure smooth operations and deliver seamless ...