
Posts from Andrew Pielage

Request Tracing in Payara Platform 5.192
Published on 15 Aug 2019
by Andrew Pielage
Topics:
JakartaEE,
Payara Platform 5,
diagnostics
|
1 Comment
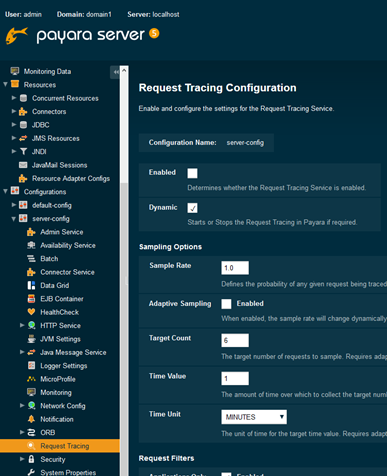
Request tracing has been a feature in Payara Platform for a number of years now, and over time it has evolved and changed in a number of ways. The crux of what the feature is remains the same, however: tracing requests through various parts of your applications and the Payara Platform to provide details about their travels.
What's New in Payara Platform 5.192 - Docker Nodes
Published on 04 Jun 2019
by Andrew Pielage
Topics:
Docker,
Payara Platform 5
|
0 Comments
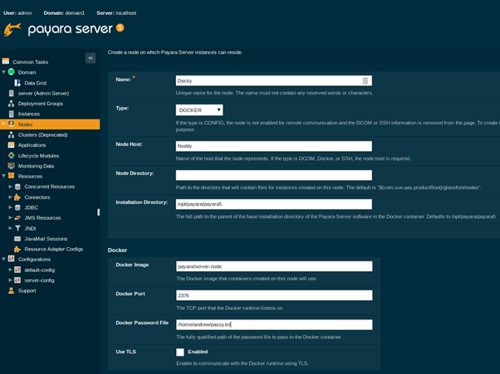
The concept of a Docker node and instance are introduced in Payara Server 5.192 as a tech preview. The aim of these is to provide better native integration of Payara Server with Docker.
Payara Platform 5.191 - MicroProfile 2.1
Published on 22 Mar 2019
by Andrew Pielage
Topics:
Payara Micro,
Microservices,
MicroProfile,
Payara Platform 5,
New Releases
|
0 Comments
The 5.191 Payara Platform release brought with it support for MicroProfile 2.1. For those who don't know, the only specification updated in this version of MicroProfile was OpenTracing, going from 1.1 to 1.2.
Why Use Docker with Payara Platform? Benefits for your Business
Published on 15 Mar 2019
by Andrew Pielage
Topics:
Payara Micro,
Docker,
Kubernetes
|
2 Comments
There's a lot of noise revolving around Docker at the moment, and with the current industry focus on the cloud, there's a good reason for that.
I hope you would already know why you might want to use Payara Platform in your business, so in this blog I'm going to focus more on why you'd specifically want to use it with Docker in a "business" context. For a start, if you're unfamiliar with Docker, please refer back to our introductory blog: What is Docker and How is it Used with the Payara Platform for a primer.
What's New in Payara Platform 191?
Published on 06 Mar 2019
by Andrew Pielage
Topics:
Payara Server 5,
Payara Platform,
New Releases
|
13 Comments

A change in the year means a change in our version number! Slightly later than our usual release month of February, we've tried to include some more changes in the release than a simple number change to make the wait worthwhile: read on to find out more!

How to Upgrade Payara Server 5
Published on 18 Dec 2018
by Andrew Pielage
Topics:
Upgrade,
Payara Server 5,
Payara Platform
|
0 Comments
This is an update of the article "How to Upgrade Payara Server."
Since Payara Server is on a regular and frequent release cycle, we get a lot of questions on how to upgrade to the latest version while maintaining existing domain configurations.
New Feature of Payara Platform 5.184: Automated Health Check Checker
Published on 03 Dec 2018
by Andrew Pielage
Topics:
Healthcheck,
Payara Platform,
New Releases
|
1 Comment
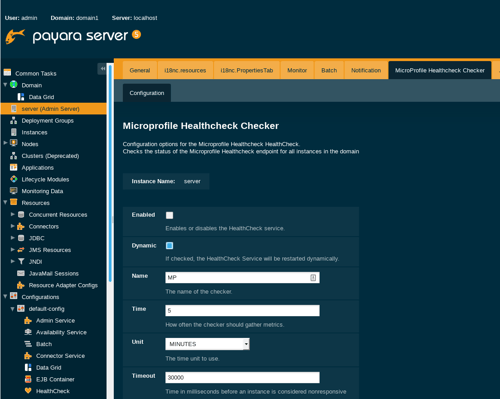
There has been a lot of noise around MicroProfile for quite a while now, and one of the specs provided by MicroProfile are Health Checks. The aim of this spec is to allow you to write a number of health checks that will run when you hit a specific endpoint, the intention being that this endpoint can be periodically poked by a container orchestrator to determine if an instance is responsive and healthy.
Making Use of Payara Server’s JMX Monitoring Service – Part 1: Setting up the Service
Published on 28 Nov 2018
by Andrew Pielage
Topics:
Monitoring,
JMX
|
0 Comments

(This is an update of this blog written in 2016: Making Use of Payara Server's Monitoring Service)
Payara Server has for a while now included a JMX Monitoring Service which can be used to log information from MBeans to the server log. Using the JMX Monitoring Service, you can monitor information about the JVM runtime such as heap memory usage and threading, as well as more detailed information about the running Payara Server instance. The information is logged as a series of key-value pairs prefixed with the string PAYARA-MONITORING:, making it easy to filter the output using tools such as Logstash or fluentd.
Did You Know? You can Install Payara Server as a Service to Automatically Start on Boot
Published on 27 Sep 2018
by Andrew Pielage
Topics:
Payara Server
|
3 Comments
Did You Know...?
You can Install Payara Server as a Service to Automatically Start on Boot
CLIによるPayara Server 5の管理
Published on 22 Aug 2018
by Andrew Pielage
Topics:
CLI,
Japanese language,
Payara Platform 5,
Payara Server
|
0 Comments

Payara Server 5が既にリリースされていますので、基本的な事柄をブラッシュアップするにはちょうど良い頃でしょう。これから、Payara ServerのCLIでできることをいくつか見てゆきたいと思います。
コマンドライン・インタフェース (CLI) はコマンドライン (またはターミナル) からPayara Serverをコントロールする手段であり、複数の方法でサーバーの起動、停止、編集を行うことができます。管理コンソールでも必要なあらゆる管理操作を実行することはできますが、CLIを用いると、特にヘッドレス・サーバー (GUIを持たないサーバー) を扱う場合において、あらゆる管理タスクをより素早く簡単に実行できる場合があります。