
Posts tagged JVM
Monitoring JMX Using the Notification Service
Published on 11 Aug 2021
by Rudy De Busscher
Topics:
How-to,
JVM,
Monitoring,
JMX,
Notifier
|
2 Comments
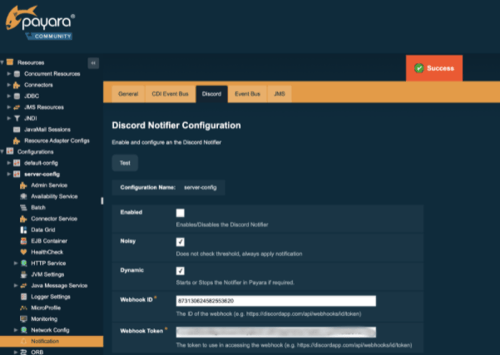
Within Payara Server, the JMX system is used to store all the data that the monitoring service captures of the modules within the runtime.
You can use any tool that can connect to the JMX system to collect these data and monitor the environment. Besides this direct access, the notifier service can send this information to various channels so that the data can be integrated with external systems.
The Notifier service is modular since October 2020 with version 5.2020.5 so that you can include only those notifiers that you are interested in and use within your environment. These notifiers cover a wide range of channels, from typical destinations like email, JMS Queues, over APM tools like DataDog and NewRelic to communication platforms like Teams, Slack, and Discord.
In this blog, we take a look at enabling JMX Monitoring for the JVM Heap Size, monitoring the process Heap Size, and then sending that information to a Discord channel.
Fine Tuning Payara Server 5 in Production
Published on 21 May 2019
by Fabio Turizo
Topics:
Production Features,
JVM,
Payara Server 5
|
13 Comments
One of the biggest challenges when developing applications for the web is to understand how they need to be fine-tuned when releasing them into a production environment. This is no exception for Java Enterprise applications deployed on a Payara Server installation.
Running a Payara Server setup is simple: download the current distribution suited for your needs (full, web); head to the /bin folder and start the default domain (domain1)! However, keep in mind that this default domain is tailored for development purposes (a trait inherited from GlassFish Server Open Source). When developing a web application, it’s better to quickly code features, deploy them quickly, test them, un-deploy (or redeploy) them, and continue with the next set of features until a stable state is reached.
(last updated 06/04/2021)
Impressions from the JVM Conference
Published on 04 Dec 2018
by Rudy De Busscher
Topics:
Microservices,
JVM
|
0 Comments
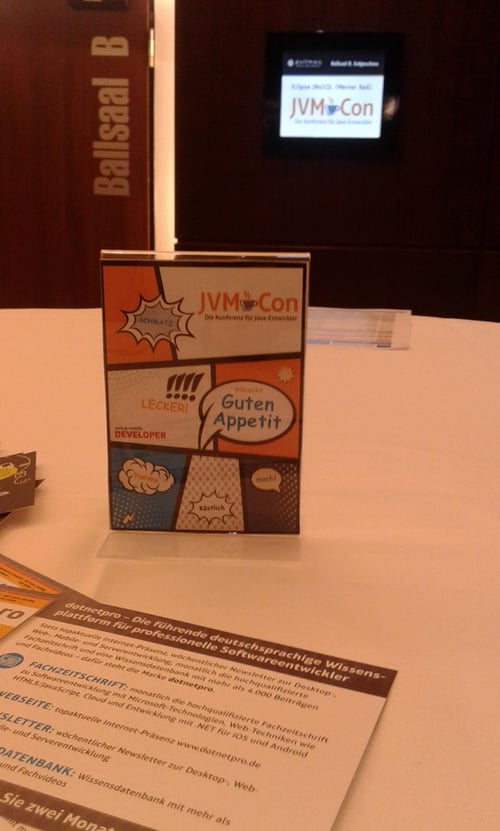
The JVM Conference is a smaller conference with two tracks. But smaller doesn’t mean it is not worth attending. There is a very broad variety in topics from plain Java SE, backend development, to micro-services and containers in cloud environments with sessions aimed at Java programmers, operators, QA staff and IT architects. You can get up to speed in the latest trends in many areas.
Installing Payara Server on Mac
Published on 18 Oct 2018
by Rudy De Busscher
Topics:
JVM,
Payara Server Basics - Series,
Payara Server 5 Basics
|
4 Comments

Introduction
This blog explains the setup of Payara Server on MacOS systems and how you can define a specific JVM which will be used to run the server.
Fine Tuning Payara Server in Production (Japanese)
Published on 12 Jul 2018
by Fabio Turizo
Topics:
Production Features,
Docker,
How-to,
JVM,
Japanese language
|
0 Comments
Webアプリケーションを開発する際における最大の挑戦の一つは、商用環境へのリリース時にアプリケーションをどのように調整すべきかを理解することです。これはJavaのエンタープライズ・アプリケーションをPayara Serverへデプロイする場合でも例外ではありません。
Fundamentos de Payara Server Parte 6 - Creando un cluster dinámico con conmutación por fallas en Payara Server con Hazelcast
Published on 29 May 2018
by Michael Ranaldo
Topics:
Hazelcast,
Payara Server Basics,
Clustering,
How-to,
GlassFish basics,
JVM,
Apache,
Payara Server Basics - Series,
Developer,
Spanish language
|
1 Comment
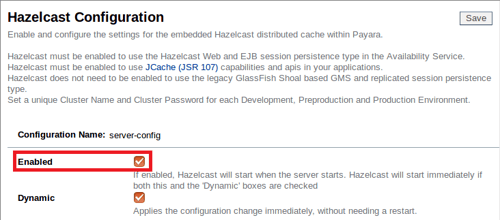
Avanzando más nuestra serie de blogs de introducción, esta entrada mostrará como puedes escalar de forma dinámica tu cluster, y como Payara Server maneja la conmutación por fallas entre miembros del cluster.
See here for the original version in English language.
La conmutación por fallas es la habilidad de continuar proporcionando acceso a nuestro sitio web o aplicación en el caso de que un servidor falle. Es una parte importante de un servicio que goza de alta disponibilidad, cuyo objetivo es minimizar los tiempos de inactividad a lo largo de tu infraestructura de servicios.
Payara Server Basics Part 7 - Creating a simple Payara Server Cluster in Windows with DCOM
Published on 08 Dec 2017
by Michael Ranaldo
Topics:
Hazelcast,
Payara Server Basics,
Clustering,
How-to,
GlassFish basics,
Scalability,
JVM,
Apache,
Payara Server Basics - Series,
Developer
|
3 Comments
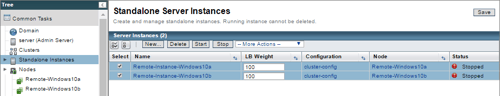
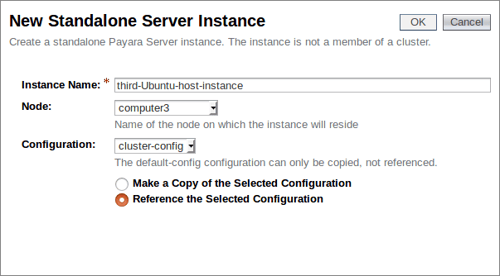
Taking our introductory series onwards, this blog will look at how you set up a simple Payara Server cluster on Windows using the native remote control protocol, DCOM. We will set up two instances on Windows 10, controlled by a third Domain Administration Server (DAS) instance on Windows 7 via DCOM, and cluster them together using Hazelcast. Finally, we will deploy our trusty clusterjsp application to demonstrate how the data is being shared across our instances.
Log directly to Logstash from Payara Server
Published on 30 Nov 2017
by Patrik Duditš
Topics:
Java EE,
JVM
|
0 Comments

(Guest blog)
When running multiple instances of an application server, it is quite hard to see correlations between events. One of the best tools to enable that is the ELK stack - Elasticsearch for building fulltext index of the log entries, Logstash for managing the inflow the events, and Kibana as a user interface on top of that.
Solutions for Payara Server exist, that use better parseable log format which can be then processed by Logstash Filebeat in order to have these log entries processed by a remote Logstash server.
In our project, we chose a different path — we replaced all logging in the server and our applications with Logback, and make use of the logback-logstash-appender to push the events directly to Logstash over a TCP socket. The appender uses LMAX disruptor internally to push the logs, so the processes does not block the application flow. This article will show you how to have this configured for your project as well.
Payara Server Basics Part 6 - Dynamic Clustering and Failover on Payara Server with Hazelcast
Published on 10 Nov 2017
by Michael Ranaldo
Topics:
Hazelcast,
Payara Server Basics,
Clustering,
How-to,
GlassFish basics,
JVM,
Apache,
Payara Server Basics - Series,
Developer
|
3 Comments
Further developing our introductory blog series, this post will look at how you can dynamically scale your cluster, and how Payara Server handles failover between cluster members.
Failover is the ability to continue to provide access to your website or application in the event of a server failing. It is an important part of high availability hosting, which aims to minimise downtime across your server infrastructure.
Payara Server Basics Part 5 - Configuring Sticky Sessions for Payara Server with Apache Web Server
Published on 01 Nov 2017
by Michael Ranaldo
Topics:
Payara Server Basics,
Clustering,
How-to,
GlassFish basics,
JVM,
Apache,
Payara Server Basics - Series,
Developer
|
0 Comments
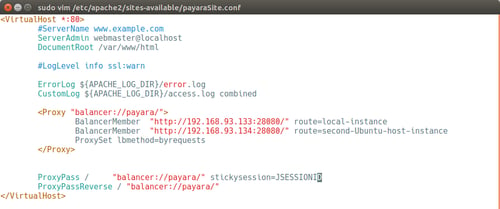
This article continues our introductory blog series on setting up a simple cluster with Payara Server, carrying straight on from our last blog where we set up load balancer on our cluster.
By clustering our Payara Servers together and balancing traffic between them with Apache Web Server we keep the benefits of having our application accessible from a single URL and gain the resilience and expansion prospects from having our application deployed across multiple instances.