
Posts tagged JMX
Monitoring JMX Using the Notification Service
Published on 11 Aug 2021
by Rudy De Busscher
Topics:
How-to,
JVM,
Monitoring,
JMX,
Notifier
|
2 Comments
Within Payara Server, the JMX system is used to store all the data that the monitoring service captures of the modules within the runtime.
You can use any tool that can connect to the JMX system to collect these data and monitor the environment. Besides this direct access, the notifier service can send this information to various channels so that the data can be integrated with external systems.
The Notifier service is modular since October 2020 with version 5.2020.5 so that you can include only those notifiers that you are interested in and use within your environment. These notifiers cover a wide range of channels, from typical destinations like email, JMS Queues, over APM tools like DataDog and NewRelic to communication platforms like Teams, Slack, and Discord.
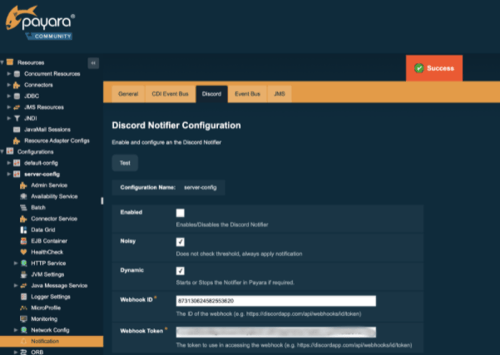
In this blog, we take a look at enabling JMX Monitoring for the JVM Heap Size, monitoring the process Heap Size, and then sending that information to a Discord channel.
Expose JMX Bean Values through MicroProfile Metrics
Published on 02 Jan 2019
by Rudy De Busscher
Topics:
MicroProfile,
Monitoring,
JMX
|
0 Comments
Payara Server provides many metrics within JMX beans. The most interesting metrics are the statistics around pools for HTTP threads and JDBC Connection pooling.
On the other hand, Payara Server also implements the MicroProfile Metrics specification. The retrieval of useful metrics from the running instance in the areas of CPU, memory, Class loading, and other MicroProfile specifications (like Fault Tolerance), are possible through the implementation of the MicroProfile Metrics in Payara Server.
Making Use of Payara Server’s JMX Monitoring Service – Part 1: Setting up the Service
Published on 28 Nov 2018
by Andrew Pielage
Topics:
Monitoring,
JMX
|
0 Comments

(This is an update of this blog written in 2016: Making Use of Payara Server's Monitoring Service)
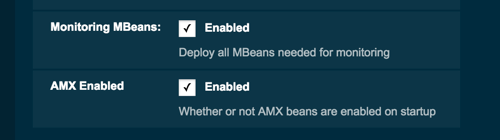
Payara Server has for a while now included a JMX Monitoring Service which can be used to log information from MBeans to the server log. Using the JMX Monitoring Service, you can monitor information about the JVM runtime such as heap memory usage and threading, as well as more detailed information about the running Payara Server instance. The information is logged as a series of key-value pairs prefixed with the string PAYARA-MONITORING:, making it easy to filter the output using tools such as Logstash or fluentd.
What's new in Payara Server & Payara Micro 174?
Published on 15 Nov 2017
by Jonathan Coustick
Topics:
What's New,
MicroProfile,
JMX
|
4 Comments

Payara Server および Payara Micro 174 がリリースされました
Published on 06 Nov 2017
by Jonathan Coustick
Topics:
What's New,
MicroProfile,
JMX,
Japanese language
|
0 Comments
Qué novedades trae Payara Server & Payara Micro 174?
Published on 06 Nov 2017
by Jonathan Coustick
Topics:
What's New,
MicroProfile,
JMX,
Spanish language
|
0 Comments
REST Monitoring in Payara Server
Published on 24 Aug 2017
by Matthew Gill
Topics:
REST,
JMX
|
5 Comments

The Payara Server 173 release included a technical preview of the REST Monitoring Service, which is a service to expose JMX monitoring MBeans over HTTP. As of Payara Server 174, this feature is no longer in tech preview.
One big problem with JMX is that JMX monitoring uses RMI (Remote Method Invocation), which can lead to a few nightmares if, for example, you have a firewall which blocks connections over RMI ports. The REST monitoring service in Payara Server now provides a service which will be very familiar to users of Jolokia in that it makes this monitoring data available over HTTP, making the data available in a more standard format (JSON) and accessible over a standard HTTP connection.
GlassFish to Payara Server Migration: Replacing the Monitoring Scripting Client
Published on 25 Jan 2017
by Fabio Turizo
Topics:
Healthcheck,
Monitoring,
JMX,
GlassFish Migration
|
0 Comments

In the fourth part of our continuing series on alternatives for commercial Oracle GlassFish features we are looking at the JMX Monitoring Service & the Payara HealthCheck Service as possible replacements for Oracle's Monitoring Scripting Client.