Posts tagged What's New (9)
CDI Scanning in Payara Server
Published on 30 Nov 2016
by Mike Croft
Topics:
What's New,
Java EE,
CDI,
How-to
|
1 Comment
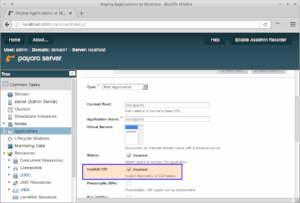
The capability to disable implicit CDI scanning was already added to the previous Payara Server releases but the default admin console setting was to enable it at deploy time. We have now made a change so that the value added to the deployment descriptor is the overriding setting and the admin console setting will be ignored.
For even more control, we have added the ability to explicitly include or exclude JARs within an Application Deployment from CDI scanning. You can now, for example, include all JARs by default and exclude some named ones, or do the opposite and exclude all by default and only include some named ones.
The MicroProfile at Devoxx: Learning Our Way Forward
Published on 21 Nov 2016
by Mike Croft
Topics:
What's New,
Java EE,
Payara Micro,
Microservices,
MicroProfile
|
0 Comments
2016 has been a bit of a wild ride, to say the least. Lots of major things have happened politically and in popular culture. Considering the world of Java and its related ecosystems, we've seen a lot of activity too, with announcements about the delay of Java 9, the concerns raised by the Java EE Guardians (shared by many), and a largely unprecedented move in the establishment of the MicroProfile initiative.
What's new in Payara Server 164?
Published on 14 Nov 2016
by Mike Croft
Topics:
What's New,
Production Features,
Hazelcast,
CDI,
Clustering,
Admin
|
0 Comments
Another quarter, another release! After an eventful 2016, November brings with it the final release of the year for Payara Server. This year, we've seen new services like Request Tracing and Health Check added, as well as the Slow SQL logger and SQL Trace Listeners. Revisiting the version of the documentation from 1 year ago and comparing the amount we have added since then is, frankly, astonishing!
Despite a bumper year for both new features and bug fixes, work continues apace! Below is a short summary of some of the things to look out for in a release that caps an incredible 12 months.
Payara Server & Payara Micro Documentation
Published on 03 Oct 2016
by Mike Croft
Topics:
What's New,
Admin
|
0 Comments
We've recently moved the documentation for Payara Server and Payara Micro from its original home in the GitHub project wiki. In doing so, we've altered the structure of the pages and introduced new ways to contribute through the GitBook platform.
Request Tracing Service in Payara Server & Payara Micro
Published on 12 Sep 2016
by Ondro Mihályi
Topics:
What's New,
REST,
How-to,
Admin,
diagnostics,
request tracing,
Notifier
|
2 Comments
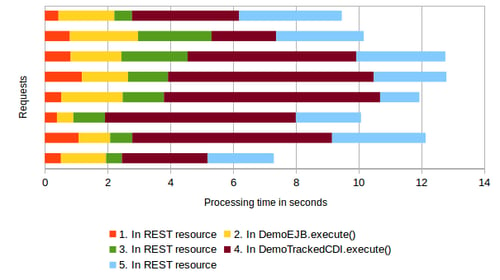
Have you ever wondered whether your application is slow to respond to requests? Which requests take the longest to respond to? And what you can do about it? Payara Server aims to provide the best tooling you would need to identify performance issues, identify their causes and help you solve them. One part of this tooling is the new Request Tracing service, available in Payara Server and Payara Micro from version 163 as a technical preview.
Persistent EJB Timers in Payara Micro
Published on 31 Aug 2016
by Ondro Mihályi
Topics:
What's New,
Production Features,
Payara Micro,
Microservices,
Hazelcast,
Caching,
Clustering,
Scalability
|
0 Comments
Payara Micro is packed with most of the features and APIs that come with Payara Server Full Profile even though it doesn't entirely support whole Jakarta EE Full Profile. As an example, Payara Micro supports persistent EJB Timers, which are only required by the Jakarta EE Full Profile and not by the Web Profile. In Payara Micro, it's possible to use persistent EJB Timers, which are stored across your micro instances inside the distributed data grid as long as at least one instance in the data grid is up and running.
Making Use of Payara Server's Monitoring Service - Part 3: Using Kibana to Visualise the Data
Published on 25 Aug 2016
by Fraser Savage
Topics:
What's New,
Payara Server Basics,
How-to
|
0 Comments
When Payara Server has been logging monitoring data to the server log for a short while, the metrics that Logstash outputs to Elasticsearch can be visualised using Kibana. In this blog post, we will create a date histogram displaying used heap memory as a percentage of the maximum heap memory.
Making Use of Payara Server's Monitoring Service - Part 2: Integrating with Logstash and Elasticsearch
Published on 24 Aug 2016
by Fraser Savage
Topics:
What's New,
Payara Server Basics,
How-to
|
1 Comment
Following the first part of this series of blog posts, you should now have a Payara Server installation which monitors the HeapMemoryUsage MBean and logs the used, max, init and committed values to the server.log file. As mentioned in the introduction of the previous post, the Monitoring Service logs metrics in a way which allows for fairly hassle-free integration with tools such as Logstash and fluentd.
Often, you might find it useful to store your monitoring data in a search engine such as Elasticsearch or a time series database such as InfluxDB. One way of getting the monitoring data from your server.log into one of these datastores is to use Logstash.
This blog post covers how to get monitoring data from your server.log file and store it in Elasticsearch using Logstash.
Making Use of Payara Server's Monitoring Service - Part 1: Setting up the Service
Published on 23 Aug 2016
by Fraser Savage
Topics:
What's New,
Payara Server Basics,
How-to
|
3 Comments
(note: there is an updated version of this blog post available here https://blog.payara.fish/making-use-of-payara-servers-jmx-monitoring-service-part-1-setting-up-the-service)
With the release of version 4.1.1.163, Payara Server includes a JMX Monitoring Service (technical preview) which can be used to log information from MBeans to the server log. Using the Monitoring Service, you can monitor information about the JVM runtime such as heap memory usage and threading, as well as more detailed information about the running Payara Server instance. The information is logged as a series of key-value pairs prefixed with the string PAYARA-MONITORING:, making it easy to filter the output using tools such as Logstash or fluentd.
In this blog series we're going to show you exactly how to use the new Payara Server Monitoring Service. First, we'll take a look at setting up the service - let's get started!
What's new in Payara Server 163?
Published on 16 Aug 2016
by Mike Croft
Topics:
What's New,
Payara Micro,
Hazelcast,
CDI,
REST
|
6 Comments
As we enter the third quarter of the year, that can only mean one thing: Payara Server 163 is here! With this release, we’ve managed to cram in 44 bug fixes, 34 enhancements, 6 new features and 6 component upgrades. One of these new features is the tech preview of our new Request Tracing service, which I’ll explain in more detail below.


