
Originally published on 08 May 2017
Last updated on 08 May 2017

Thread dumps are a useful tool for debugging an application that's running slowly, or is otherwise causing problems. A thread dump is a snapshot of what each running thread is doing at a particular moment. It allows you to see if a thread is running, waiting, or stalling. This two-part guide will show you how to take a thread dump of Payara Server, and how to get useful information from it.
You can either take a thread dump from the terminal or from VisualVM. VisualVM gives you an easy-to-view visual representation of the threads, and also allows you to take heap dumps as well as monitor other parts of the application, whereas there are a few terminal commands designed purely for taking thread dumps. We will cover both methods here, so it would be helpful to try both methods and see which you prefer.
VisualVM
VisualVM is only included in the Oracle JDK. If you have that installed, then you're good to go! If you have the OpenJDK or another JDK (though not IBM JDK, which is incompatible), then you'll need to install it manually. For the major Linux distributions this just means installing it from your default repository.
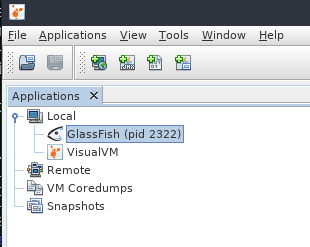
By convention, all bundled JDK tools begin with the letter J, so if you have Oracle JDK you will need to run 'jvisualvm'. To start VisualVM, run 'visualvm' from your command line. Once you're in, find the local running Payara Server process in the left-hand pane:
Be careful here! VisualVM is connecting directly to the JVM process, so you need to make sure you are running VisualVM under the same OS user as Payara Server. This is especially an issue on Windows environments where Payara Server may be installed as a service; in these environments VisualVM will not be able to detect the local Payara Server process as it does here.
If you open this process, you'll see a bunch of monitoring data. We're only interested in the thread information right now, so click the "Threads" tab to be taken to an overview of the currently running threads in Payara Server.
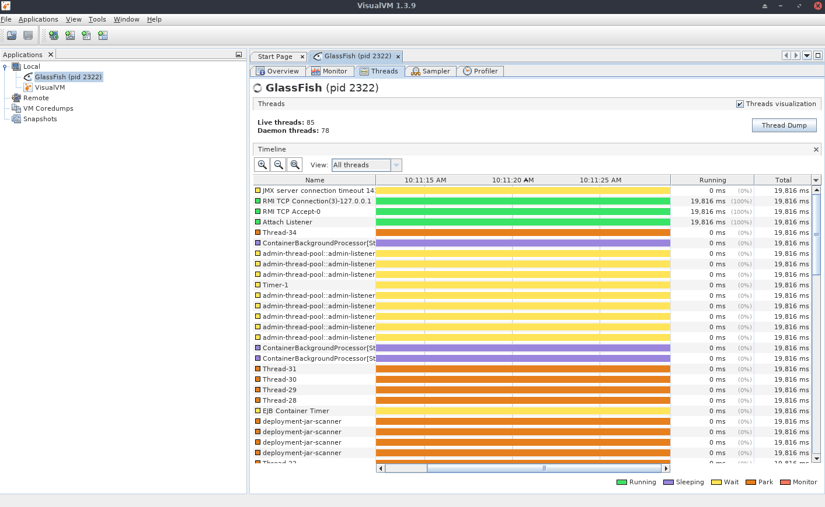
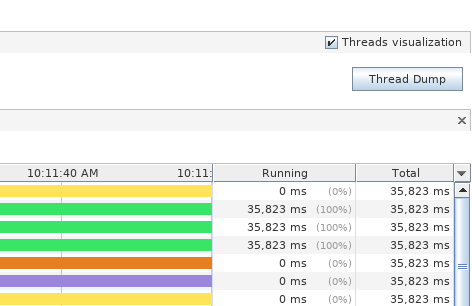
Payara Server runs a lot of threads by default, and you shouldn't need to worry about any of them unless they're causing problems. If there are any problems however, VisualVM may notify you of the problem by prompting you to take a thread dump. If it doesn't notify you, but you are experiencing problems with your application, then take a thread dump anyway by clicking on 'Thread Dump' in the top right.
Once you do, a new tab will open showing the thread dump contents.
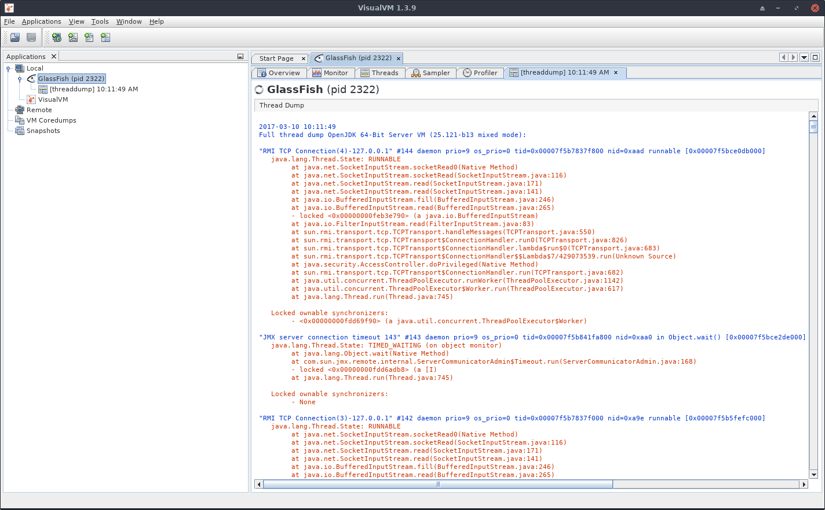
The next part of this blog will go through reading these thread dumps - for now, we will look at taking thread dumps with the terminal!
Terminal
There are a few tools which can be used to take a thread dump. They are:
- JStack
- Kill (Linux only)
- Asadmin
We will discuss the advantages of each one.
JStack
JStack is included in the JDK, so you shouldn't need to install anything. To start off, you need the process ID of the Payara instance which you can find by running 'jps' from the command line. The Payara process will be called ASMain.
Once you've found this, run jstack and pass the Payara Server process ID to the command:
jstack 4278
The output will look similar to this:
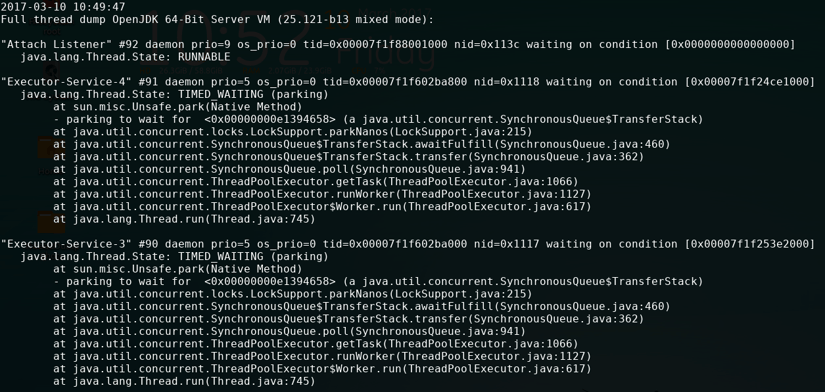
This isn't a particularly easy format to use; it's hard to view in the terminal and your terminal emulator may not have a big enough buffer to hold all of the thread dump!
If you want the output redirected from standard output in to a file which you can open in a text editor, pipe it into a named file as shown below.
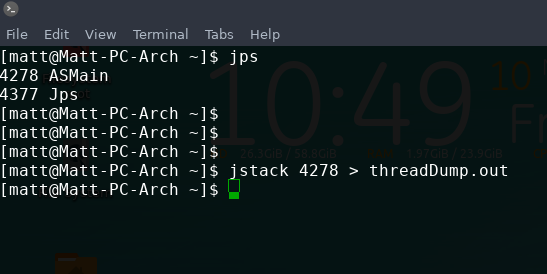
JStack is useful as it produces a standard format for thread dumps, and is the standard tool for thread dumps in the JDK. It can also generate a thread dump from a remote Payara instance.
Kill
Kill is a standard Linux command, so can be used for all Linux systems. It's purpose is to send a signal to a running process. This often means ending the process (hence the name!), but in some cases this command can be useful for other things. You can pass a signal to send as an argument. By default, the signal sent is TERM, which is a signal that the process can catch and handle, so it will terminate gracefully. Running "kill -l" will give you a list of commands you can send to processes.
Sending "kill -3 [pid]" to a running process will send SIGQUIT, which will cause it to give a thread dump. When using it with Payara Server, you must be running the server in verbose mode (-v) which causes the output to be displayed in the server log. In the example below, I have started the server in verbose mode, and then redirected both STDOUT and STDERR to a file called "server.out":
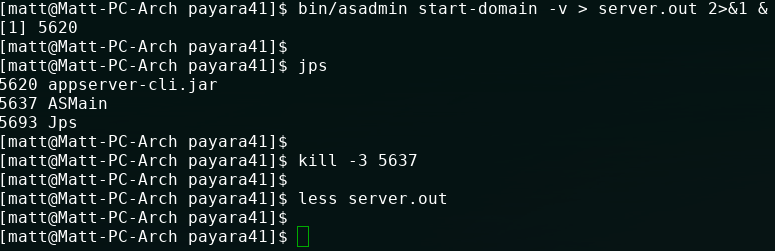
jps will print out the process ids of every running Java process. The Payara Server will always be called "ASMain", since this is the name of the main class which starts the server. This process id can then be passed to the kill command with the signal 3. Underneath that, the file specified earlier is then opened for reading using less - the thread dump will be contained in the log.
This method is good if you want a small heap dump summary as well (there's one contained at the bottom!), or if you're working on a system without an installed JDK, as kill is contained on every Linux based system. Unfortunately this will only work for local processes, so for remote instances you'll need one of the other two methods.
Asadmin
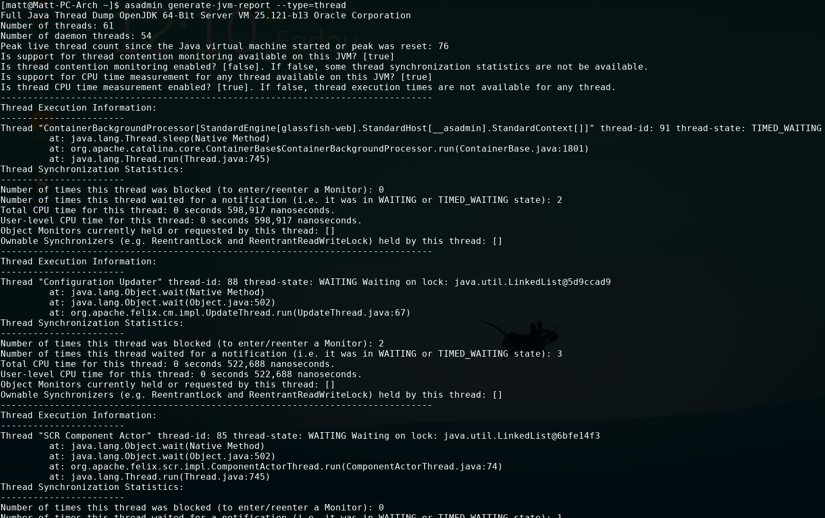
Asadmin is the default utility for performing administrative tasks for Payara Server. It can be used to generate a thread dump as well as other useful information.
asadmin generate-jvm-report --type=thread |
This command will generate a thread dump in the standard output. It prints it out in a slightly different format to the other two methods, and is slightly more readable. It's worth mentioning however, that JStack produces a more standard format, so will likely be more appropriate when showing to other people or parsing.
In the second part of this blog, we will go through reading these thread dumps, as well as finding the cause of a deadlock.
Related Posts
Continuous Integration and Continuous Deployment for Jakarta EE Applications Made Easy
Published on 25 Mar 2024
by Luqman Saeed
1 Comment
Continuous Integration and Continuous Deployment (CI/CD) activities are designed to convey your Jakarta EE applications to end users. Thanks to the unique flexibility of Jakarta EE, multiple CI/CD options are available to software developers. ...
Easy Jakarta EE Integration Testing with the Payara Platform and Testcontainers
Published on 24 Mar 2022
by Fabio Turizo
0 Comments
One major issue when developing modern enterprise applications is the "works on my machine" problem: when an application works well on your machine but is not functional in production or even on a colleague's machine. An even more prevalent ...