
Originally published on 11 May 2017
Last updated on 11 May 2017

The previous part of this blog showed how to take a thread dump of Payara Server. This part will go through reading these thread dumps, particularly in regard to identifying deadlocks.
The Format of a Thread Dump
Below is a breakdown of a thread dump.
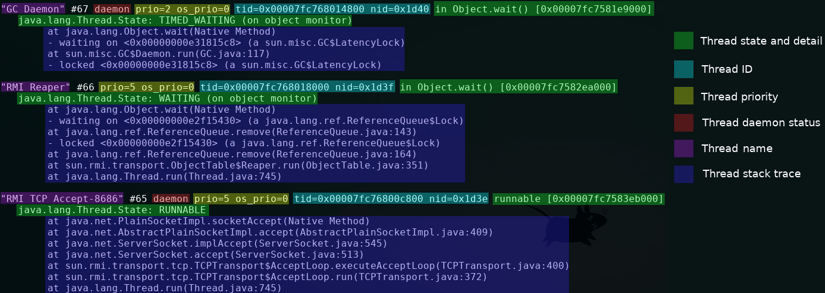
- Thread Name
The thread name is self explanatory. These names are very useful when debugging, however, as it gives something to search the codebase for when debugging code. Payara Server has already added fixes for instances where internal threads were not always named, so thread dump information can be more helpful now. - Thread Priority
Each thread is given a priority by both Java, and the OS it's being run on.prioandos_prioshow these as reported by Java and the OS respectively. - Thread Daemon Status
Threads can either be a daemon or non-daemon thread. A daemon thread will be closed when there are no non-daemon threads running. An example of a daemon thread would be garbage collection. - Thread ID
Each thread is given an ID by Java and the OS. the Java thread ID is calledtid, and is the one that would be returned bythread.getId(). The OS thread id is callednid, and is useful for referring to a thread when seeing if a thread is taking up too much memory. - Thread State and Detail
Each thread has a state as well as details of what it's doing. There are a few different states that a thread can be in:- NEW: A thread has just been created but isn't doing anything.
- RUNNABLE: A thread is currently processing a task.
- WAITING: A thread is waiting for external input.
- TIMED WAITING: A thread is waiting, except is can be freed up by a maximum amount of time as well as an external input.
- BLOCKED: A thread is waiting for another thread to release it's lock.
- Thread Stack Trace
Each thread has a call stack, which gives exactly which methods have been called for it to get to the point where it currently is.
Identifying Deadlocks
A deadlock is when two or more threads have a lock over some resources and are both waiting for each other to give up their lock, which causes them to hang. Deadlocks aren't always easy to spot, but they can be extremely problematic when they occur. They are often only stopped by restarting the server and removing the problem.
Below, I have made a simple servlet to demonstrate the problem by creating a deadlock when it receives too many requests at once:
@WebServlet("/deadlock")
public class DeadlockServlet extends HttpServlet {

    @Inject
    private Model model;

    @Inject
    private View view;

    @Override
    protected void doGet(HttpServletRequest req, HttpServletResponse resp) throws ServletException, IOException{
        resp.getWriter().println("Request completed.\n");

        for(String key: req.getParameterMap().keySet()){
            model.putData(key, req.getParameterMap().get(key)[0]);
        }
        view.update(resp.getWriter());
    }

    @Override
    protected void doPost(HttpServletRequest req, HttpServletResponse resp) throws ServletException, IOException{
        doGet(req, resp);
    }
}
Although, in reality, for something like this you would normally want to use something like CDI Events, this method suits the purpose of creating a deadlock. There is nothing immediately wrong with this servlet. On a GET request it will add each key-value pair parameter to an injected model, and it will call the view in order to print it to the response.
@ApplicationScoped
public class Model implements Serializable{

    private Map<String, String> data;

    @Inject
    private View view;

    @PostConstruct
    private void init() {
        data = new HashMap<>();
    }

    public synchronized void putData(String key, String value){
        data.put(key, value);
        view.update(new PrintWriter(System.out));
    }

    public synchronized String getData(){
        String content = "";
        for(String key: this.data.keySet()){
            content += key+ ": " + this.data.get(key) + "\n";
        }
        return content;
    }
}
The Model bean is @ApplicationScoped, meaning that there is only one per application instance - in other words, every user will use the same model, and will be able to see and add to the same list. The model is just a map of key-value pairs. it can put data into that map, and return a string representation of it. Both of these operations are synchronized, meaning that multiple threads can't manipulate the model at the same time.
@ApplicationScoped
public class View {

    @Inject
    private Model model;

    public synchronized void update(PrintWriter out) {
        out.println(model.getData());
    }
}
The View bean is also @ApplicationScoped. It has a synchronized method which allows the view to print the model to a given PrintWriter.
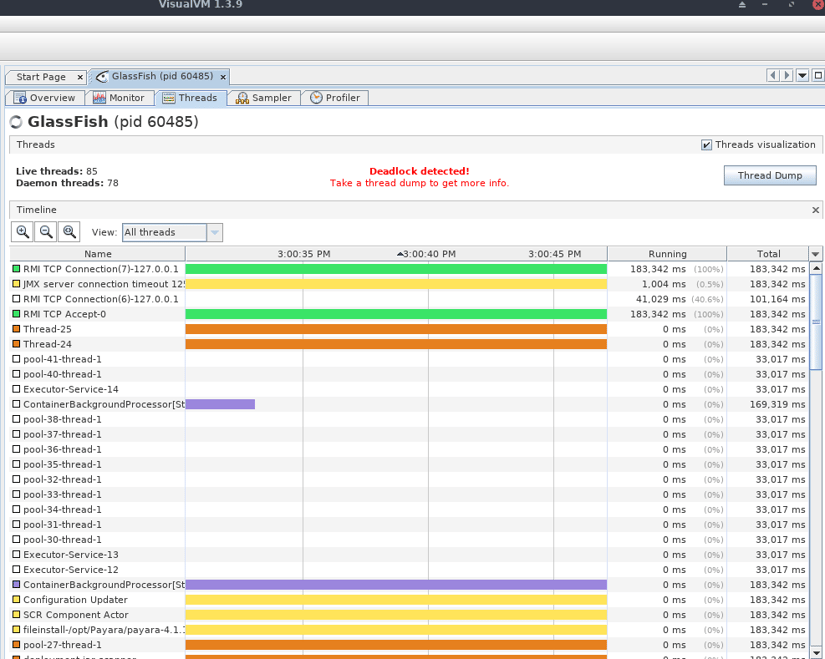
Each user of a servlet is given their own thread. Knowing this, there doesn't appear to be any code that would cause a threading problem. If however, one thread accesses the view's update() method whilst another thread accesses the model's putData() method, it will cause a deadlock. This is because the view object is waiting for the model's lock, and the model object is waiting for the view's lock, but neither will give up their lock. This will cause the two threads to hang, and will slow down your server. If you're using VisualVM and you call this servlet enough times in a short space of time, you will see an error like this:
Even if you're not using VisualVM, then take a thread dump and you'll see the following problem.
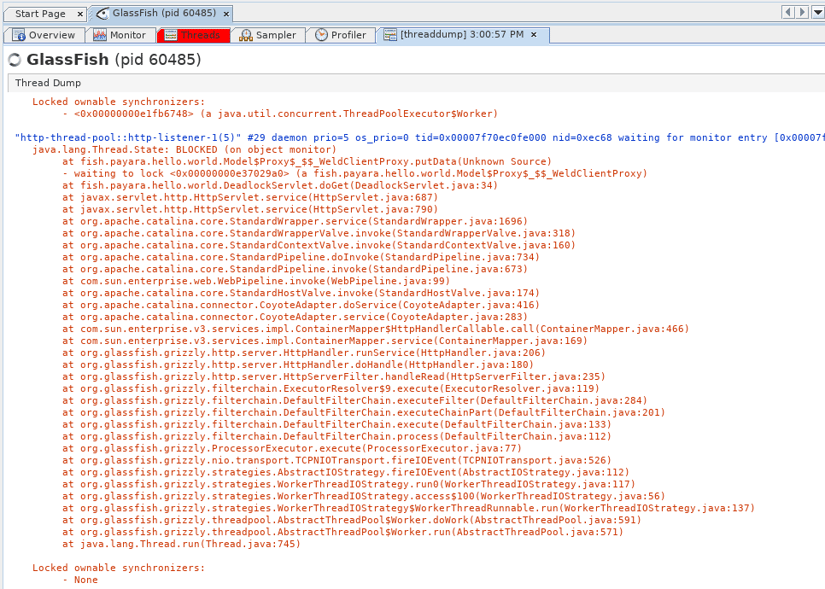
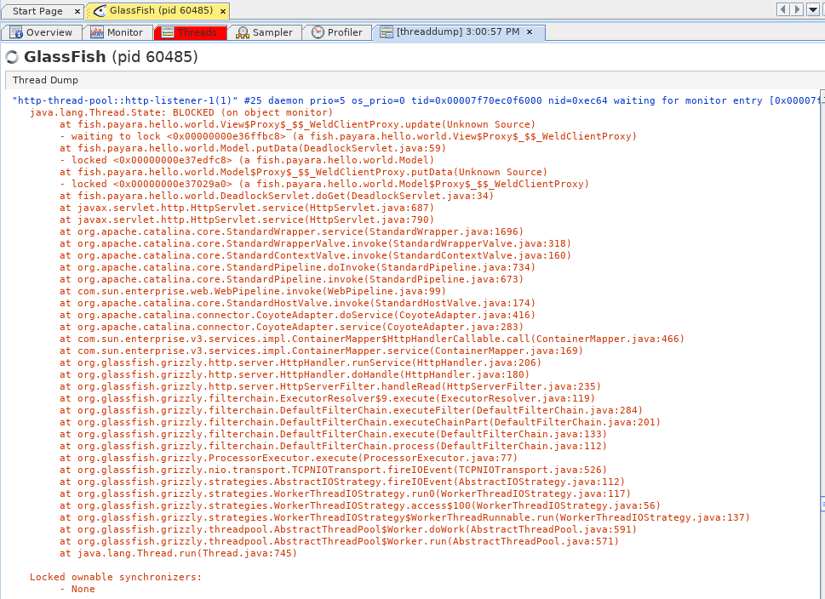
As you can see the two threads here are waiting on each other. The first trace stack is pointing towards Model.putData(), and the second is pointing towards View.update(). This is the cause of the problem, and will give you a good starting point for your investigation on fixing the problem.
Related Posts
Continuous Integration and Continuous Deployment for Jakarta EE Applications Made Easy
Published on 25 Mar 2024
by Luqman Saeed
1 Comment
Continuous Integration and Continuous Deployment (CI/CD) activities are designed to convey your Jakarta EE applications to end users. Thanks to the unique flexibility of Jakarta EE, multiple CI/CD options are available to software developers. ...
Easy Jakarta EE Integration Testing with the Payara Platform and Testcontainers
Published on 24 Mar 2022
by Fabio Turizo
0 Comments
One major issue when developing modern enterprise applications is the "works on my machine" problem: when an application works well on your machine but is not functional in production or even on a colleague's machine. An even more prevalent ...