
Search Results for “monitoring console”
-
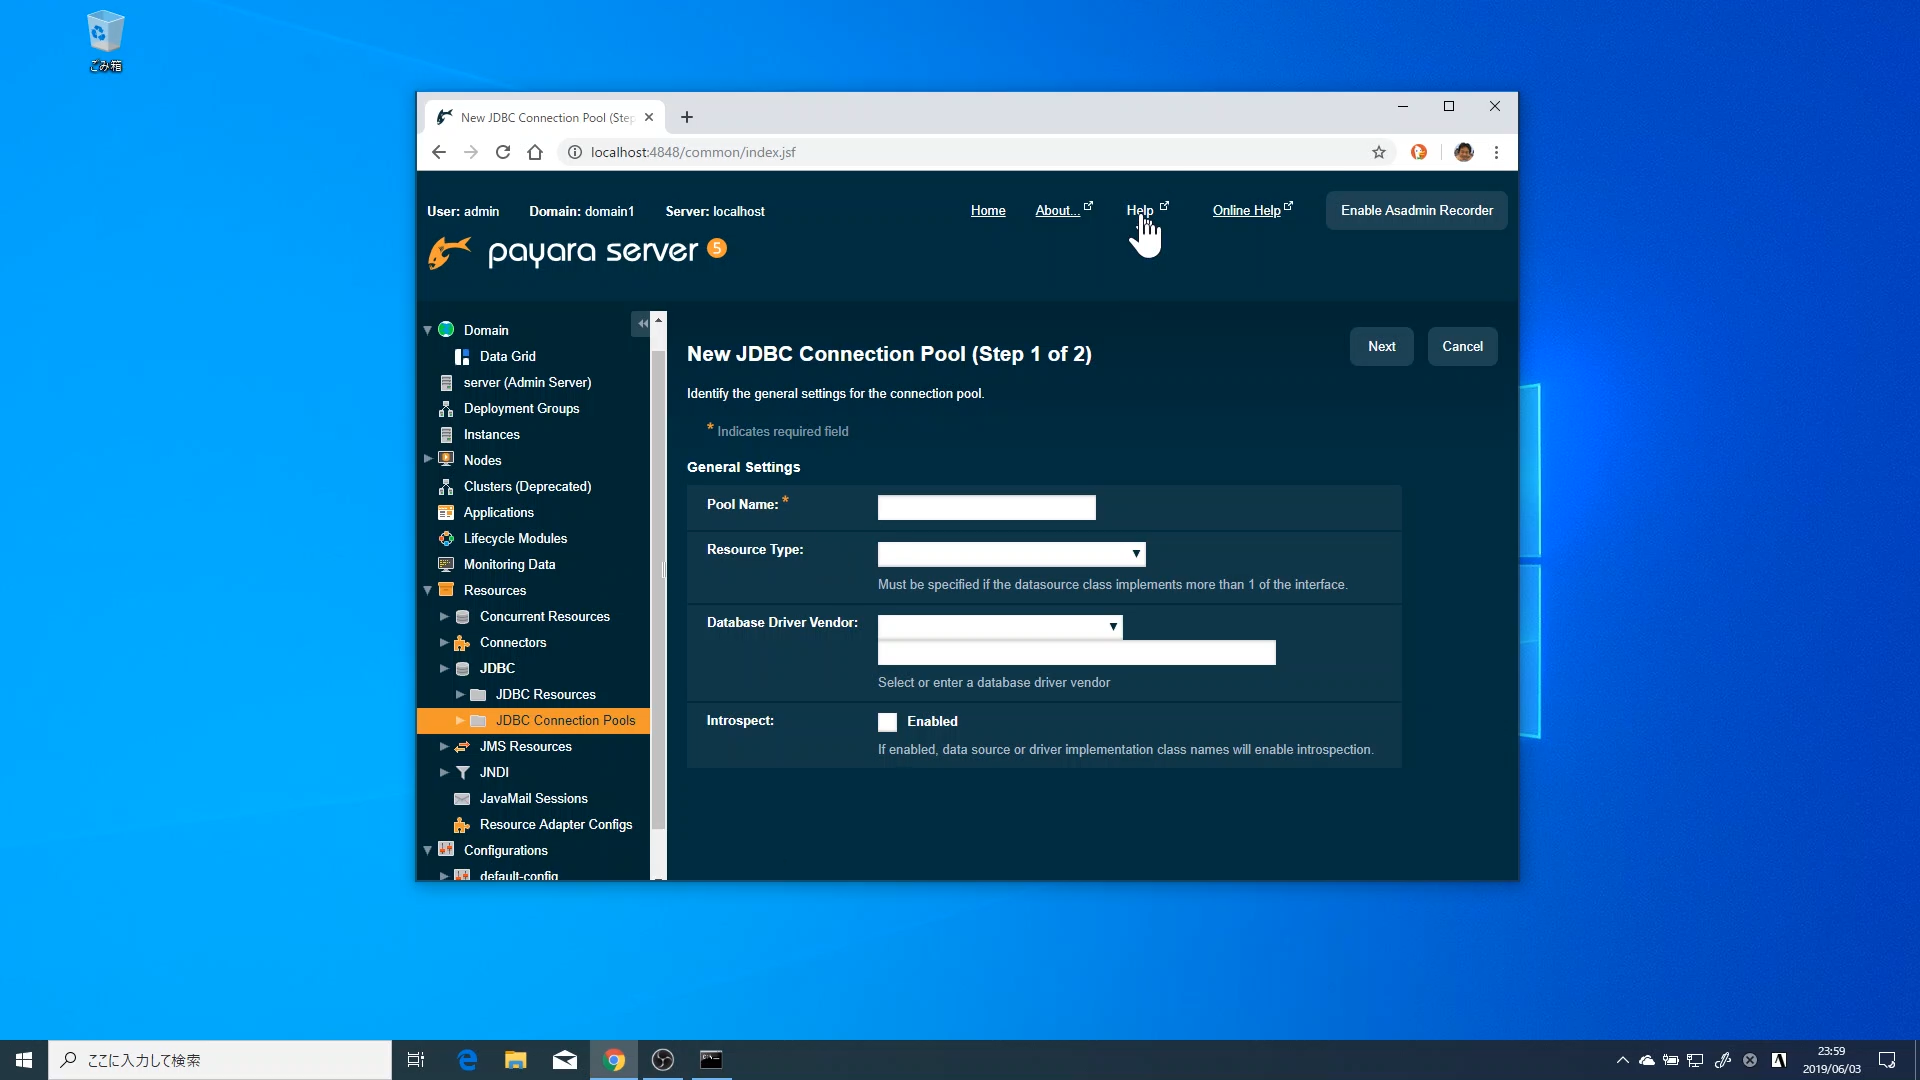
Did You Know? Payara Server Admin Console has Embedded Online Help If you click "Help" in the top navigation of the Admin Console, a pop up will appear.... There are a lot of monitoring and alert mechanisms available within Payara Server . For example, it is possible to report user requests or database calls that take too long, or to report when high CPU or high memory usage occurs. But it is ...... Since Payara Server 5.191, the Admin Console has embedded online help. It was imported from Eclipse GlassFish and offers assistance for you when using the Admin Console.
-

Did You Know? Payara Server Now Comes with MicroProfile Admin Console Integration! Find out more about MicroProfile Admin Console integration by watching our 5.183 release webinar: Payara Platform 5.183 Release Webinar... Find out more about MicroProfile Admin Console integration by watching our 5.183 release webinar: Payara Platform 5.183 Release Webinar... Since Payara 5.183, you can now view and configure the MicroProfile API using the Admin Console. This means all the MicroProfile API configurations is in one single location, which eliminates the need to use multiple 'asadmin' commands.
-

How to Join Payara Micro Instances to the Data Grid in the Admin Console (Japanese Language) まず、Payara Microをデータ・グリッドへ参加させる前に、Payara Serverのドメイン管理サーバー(DAS)を起動しておく必要があります。ここでは、DASはdashost上にあるものとします...
-

Common Issues with Eclipse GlassFish You Won't Have with Payara Server Enter the Asadmin Recorder! This is a powerful feature that is available in the Web administration console of Payara Server, and when enabled, allows the server administrator to record all of the operations that change the configuration of an existing domain into a localised script file that can be later used to automate the server configuration without worrying about suddenly making mistakes.... One of the main advantages of using application servers is that most (if not all) offerings on the market come with integrated monitoring facilities that allow DevOps teams to reliably gather real-time data about the state of the server and quickly take action. GlassFish is no stranger...
-

REST Monitoring in Payara Server The Payara Server 173 release included a technical preview of the REST Monitoring Service, which is a service to expose JMX monitoring MBeans over HTTP. As of Payara Server 174, this feature is no longer in tech preview. One big problem with JMX is that JMX monitoring uses RMI (Remote Method... Invocation), which can lead to a few nightmares if, for example, you have a firewall which blocks connections over RMI ports. The REST monitoring service in Payara Server now provides a service which will be very familiar to users of Jolokia in that it makes this monitoring data available over HTTP...
-
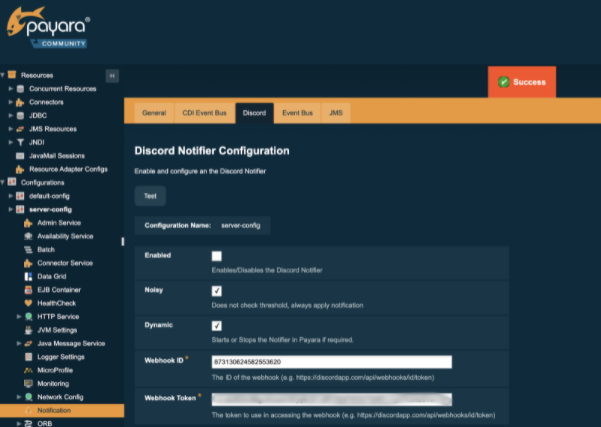
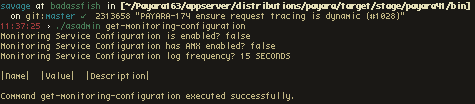
Monitoring JMX Using the Notification Service Monitoring If you don't already have it enabled, the monitoring service can be started by using an Asadmin CLI command or via the Admin Console. To have the Heap Size data available, make sure you set the module JVM to level HIGH. Via asadmin commands The monitoring service itself is enabled... Within Payara Server, the JMX system is used to store all the data that the monitoring service captures of the modules within the runtime. You can use any tool that can connect to the JMX system to collect these data and monitor the environment. Besides this direct access, the notifier service can...
-

Payara Server 163 Sneak Peak - Improved Monitoring Among many other improvements, the upcoming 163 release of Payara Server ( out in August) fixes some inaccuracies in monitoring statistics, which are also present in the recent version of GlassFish. Monitoring feature of Payara Server, including exposing real-time statistics through a built-in REST... Among many other improvements, the upcoming 163 release of Payara Server ( out in August) fixes some inaccuracies in monitoring statistics , which are also present in the recent version of GlassFish. Monitoring feature of Payara Server, including exposing real-time statistics through a built...
-

GlassFish to Payara Server Migration: Replacing the Monitoring Scripting Client In the fourth part of our continuing series on alternatives for commercial Oracle GlassFish features we are looking at the JMX Monitoring Service & the Payara HealthCheck Service as possible replacements for Oracle's Monitoring Scripting Client.... With the Monitoring Scripting Client, administrators and other operations staff can write JavaScript templates that enable monitoring probes to execute the following tasks:...
-
Making Use of Payara Server's Monitoring Service - Part 2: Integrating with Logstash and Elasticsearch Following the first part of this series of blog posts, you should now have a Payara Server installation which monitors the HeapMemoryUsage MBean and logs the used , max , init and committed values to the server.log file. As mentioned in the introduction of the previous post, the Monitoring Service logs metrics in a way which allows for fairly hassle-free integration with tools such as Logstash and fluentd.... Often, you might find it useful to store your monitoring data in a search engine such as Elasticsearch or a time series database such as InfluxDB. One way of getting the monitoring data from your server.log into one of these datastores is to use Logstash.
-
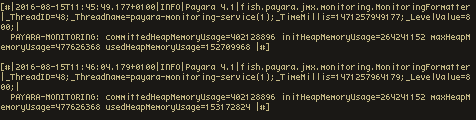
Making Use of Payara Server's Monitoring Service - Part 1: Setting up the Service (note: there is an updated version of this blog post available here https://blog.payara.fish/making-use-of-payara-servers-jmx-monitoring-service-part-1-setting-up-the-service) With the release of version 4.1.1.163, Payara Server includes a JMX Monitoring Service (technical preview) which can... be used to log information from MBeans to the server log. Using the Monitoring Service, you can monitor information about the JVM runtime such as heap memory usage and threading, as well as more detailed information about the running Payara Server instance. The information is logged as a series of key...