
Originally published on 21 Sep 2020
Last updated on 16 Jul 2021

If you're running your applications using Eclipse GlassFish, or one of its older iterations, you may have encountered one of the following common issues that hamper the productivity of your application development and overall server management in some capacity:
- Lack of automation assistance
- Inability to quickly browse metrics
- Missed critical server events
- Lack of modern security standards support
- Problems preparing container images to deploy on the cloud
- Classloading conflicts with third-party libraries
Although these scenarios are common when running an Eclipse GlassFish project, they already have existing solutions implemented as part of the Payara Platform. As Payara Server started life as a fully-supported drop-in replacement for GlassFish, GlassFish users find migrating to Payara Server offers a powerful application server that meets their needs while overcoming the common GlassFish scenarios listed above.
Let's go through these scenarios and showcase how the Payara Platform brings solutions to each one of them.
Automation Assistance
In this day and age, DevOps is usually one of the most coveted topics for any organisation: The need to automate the integration and delivery of all aspects of your applications and their dependencies is a constant requirement in most projects.
Imagine that you are moving your GlassFish domains and instances from one environment to another (maybe even in the cloud) and you have to repeat all the steps needed to re-configure this new environment. If you are familiar with all of the different combinations of the asadmin command-line tool, you might be able to do this easily by writing all relevant commands in a structured script that can automate the creation and provisioning of your server installation, but what happens if you are not that proficient with it? You can browse the operation/administration manuals and bit by bit assemble these scripts, but this sounds cumbersome and error-prone. There should be some assistance that can help you achieve this goal.
Enter the Asadmin Recorder! This is a powerful feature that is available in the Web administration console of Payara Server, and when enabled, allows the server administrator to record all of the operations that change the configuration of an existing domain into a localised script file that can be later used to automate the server configuration without worrying about suddenly making mistakes.
Thanks to the recorder, every time you may want to automate the steps to configure your domain, simply turn it on, proceed to configure all the settings needed, grab the local file and adapt it to run by your DevOps tools (Chef, Ansible, Jenkins, etc.).
You can read more about this feature in the official Payara Server Community documentation.
Real Time Metrics Browsing
One of the main advantages of using application servers is that most (if not all) offerings on the market come with integrated monitoring facilities that allow DevOps teams to reliably gather real-time data about the state of the server and quickly take action. GlassFish is no stranger to this concept and it ships with an integrated JMX server that gathers useful JVM statistics (GC behaviour, Heap data, CPU load, etc.) and also can be configured to gather metrics for internal application behaviour (HTTP connections, web sessions, threading, EJB usage, etc.). It is a powerful monitoring system with a bit of a learning curve, but demonstrably useful once put in motion.
There is a common situation experienced when using the GlassFish monitoring system. It relies on external JMX client tools (like JVisual VM, JConsole or Mission Control) to connect to the internal JMX server to browse and display these statistics in a way that is useful to any DevOps engineer to quickly understand what is the general state of the server's runtime. On production systems, the act of configuring this connection can become frustrating since remote JMX connections are secured by default and thus require clients to have preconfigured CA certificates to establish them.
Payara Server also suffers from this scenario, but instead of re-inventing the wheel, it possesses a powerful display and analysis tool: The web monitoring console, which is an internal application that can be quickly enabled to allow DevOps engineers to quickly browse through multiple pre-configured pages of metric graphs that display common metrics that are useful for most day-to-day inspections. Here's a glance of how the console looks:
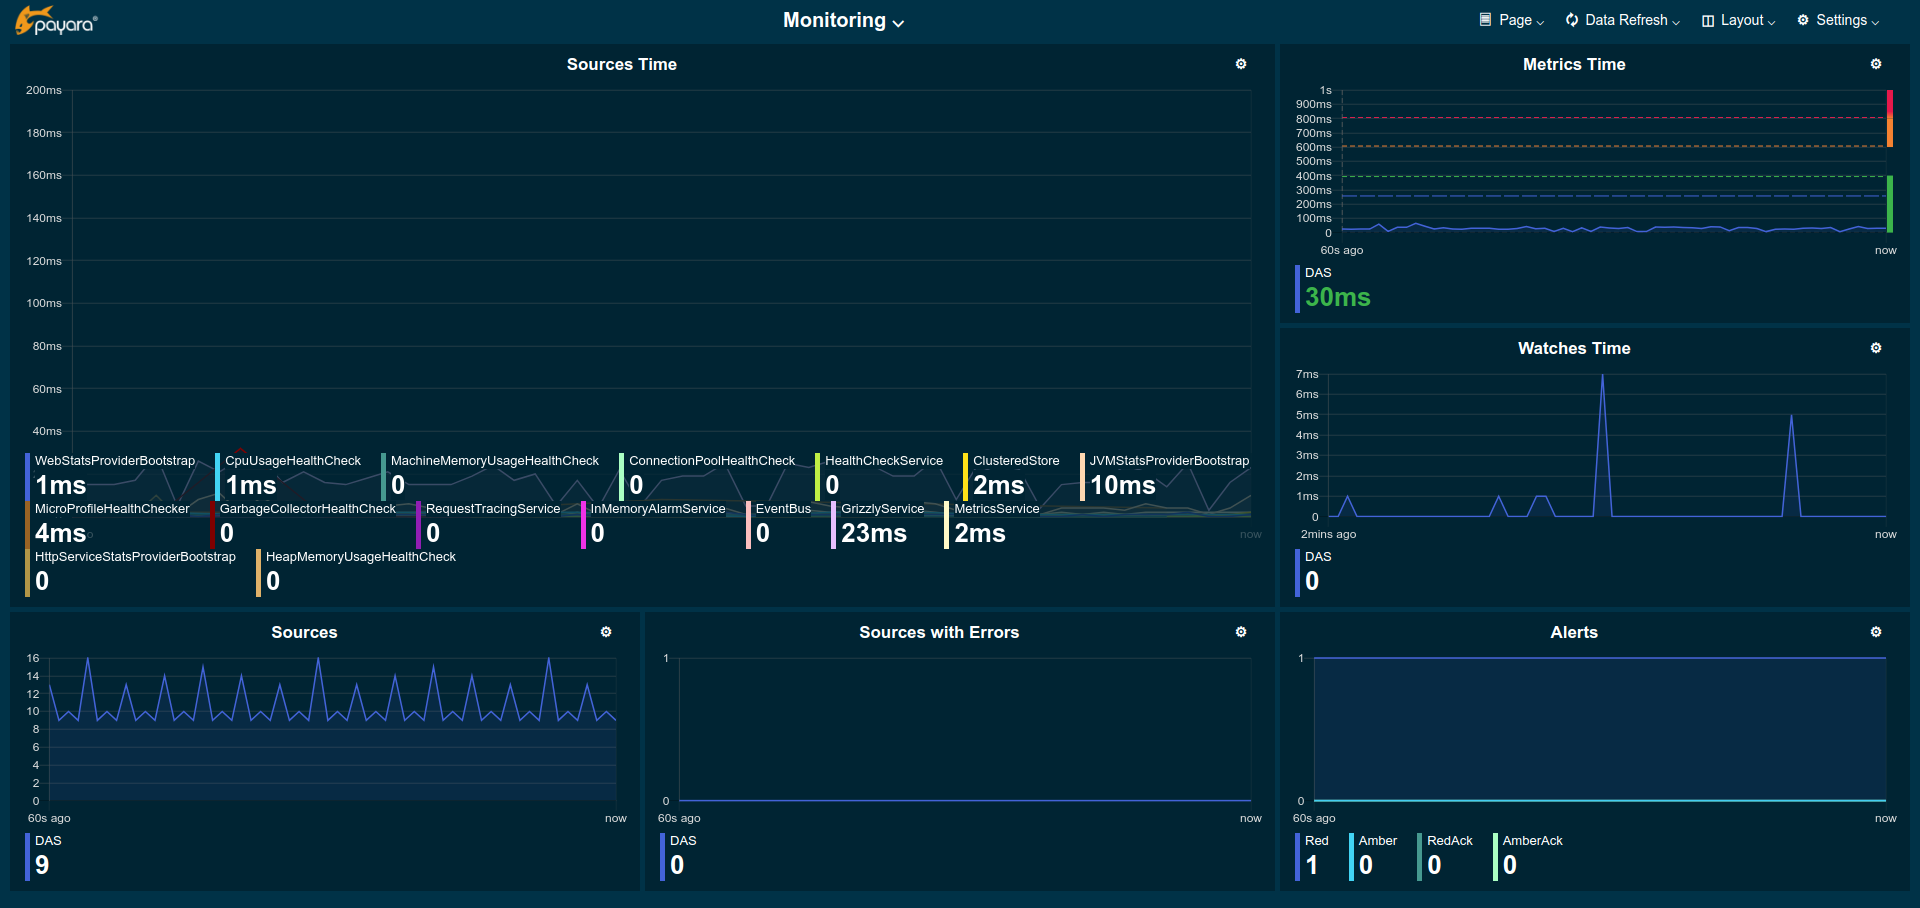
It shows all the data available to any user that has access to the server's DAS without requiring any additional tools. Just using a web browser is more than enough. Even better, the console itself is a simple web application that can be customized with additional pages and graphs for any custom metrics that your team is interested in monitoring frequently.
You can read more about this feature in the official Payara Server Community documentation.
Critical Server Event Alerts
Continuing from the previous scenario, it is recommended that DevOps engineers are aware in a general sense of what is happening with their environments 'under the covers'. In most cases, plugging external tools to monitor the state of the server and then generate alerts when the server has encountered critical conditions (90% of memory used, CPU being hogged by threads for a considerable amount of time, etc.), is more than enough but it is not ideal.
Wouldn't it be better for the server to generate these events itself and let whoever is listening take action? Payara Server comes equipped with the following internal services that make this a reality:
- A Healthcheck service, which monitors the state of all server instances in a domain and generates alerts on the following events:
- CPU Usage goes over a certain threshold
- Heap/Machine Memory goes over a certain threshold
- Threads are detected to be hogging the CPU over a certain period
- Threads that are stuck in blocking state over a certain period
- JDBC Connection Pools are at capacity on their free/used connection ratio
- Garbage Collection is taking a significant amount of time
- A Request Tracing service, which generates events when requests get processed by applications deployed in a domain to trace performance in OpenTracing format.
- A Notification service, which is responsible for casting the events generated by the previous services to any configured channels to make sure that DevOps teams take action.
This last one is particularly important: with its default configuration, the notification service will log all events to the server's log, which is not a useful mechanism to be aware of critical incidents. The service allows the configuration of multiple cloud-friendly "channels" that can be used by big DevOps teams in real-time, like:
- Email, via the SMTP protocol
- Datadog
- Slack
- NewRelic
- Standard JMS messages
- SNMP events
- XMPP events
- Hazelcast Event Bus
- CDI Event Bus, which allows any CDI-compatible application to observe the event
With so many notification mechanisms to choose from, it is easy for DevOps teams to choose which ones are compatible with their current infrastructure and configure them correctly, thus eliminating the need to set up additional tools.
You can read more information about the configuration of these services in the official documentation here:
Modern Security Standards
Security is one of the main concerns of any DevOps engineer when starting new projects, and most enterprise Java engineers are aware of the ups and downs of the several Java EE security APIs (JAAS, JACC, JASPIC) that are present in both GlassFish and Payara Server.
With the advent of Java/Jakarta EE 8, a new API focused on standardizing security mechanisms for web applications was included: The Java/Jakarta EE Security API, which proposes standard authentication mechanisms and identity stores that can be easily defined by application developers. Unfortunately, although EE Security is a powerful API, it is still not enough for today's modern application development's landscape.
Modern application and services are recurring to powerful standardized solutions that delegate the bulk of identity management to third-party services that are compatible with the OpenID Connect set of standard. The Payara Platform brings a combination of standard APIs and proprietary features that allow DevOps engineers to integrate their services with a few lines of code:
OpenID Connect support via the @OpenIdAuthenticationDefinition annotation which allows applications to integrate with standard OIDC machine-to-machine authentication flows:
@OpenIdAuthenticationDefinition(
       providerURI = "https://sample-openid-server.com",
       clientId = "87068hgfg5675.apps.sample.com",
       clientSecret = "${my-secret}",
       redirectURI = "${base-url}/callback"
)
public class OIDCConfigurationBean {
}
Additionally, special annotations for connecting to Google's and Microsoft Azure API OIDC flows are available as well:
@GoogleAuthenticationDefinition(
providerURI="#{configurationBean.tokenEndpointURL}",
clientId="#{configurationBean.clientId}",
clientSecret="#{configurationBean.clientSecret}"
extraParameters = {"access_type=offline", "approval_prompt=force"}
)
public class GoogleOIDCConfigurationBean {
}@AzureAuthenticationDefinition(
providerURI="#{configurationBean.tokenEndpointURL}",
clientId="#{configurationBean.clientId}",
clientSecret="#{configurationBean.clientSecret}",
tokenAutoRefresh = true,
scope = {OPENID_SCOPE, EMAIL_SCOPE, PROFILE_SCOPE, OFFLINE_ACCESS_SCOPE}
)
public class AzureOIDCConfigurationBean {
}
This feature depends on the Payara's Platform Public API. More information can be found here.
OAuth2 support provided by the annotation @OAuth2AuthenticationDefinition, which allows applications to authenticate users via standard identity tokens retrieved from OAuth2 implicit flows. This annotation is used to configure the corresponding endpoints and parameters used to implement the flow:
@OAuth2AuthenticationDefinition(
    authEndpoint="https://accounts.google.com/o/oauth2/v2/auth",
    tokenEndpoint="https://www.googleapis.com/oauth2/v4/token",
    clientId="${my-key}.apps.googleusercontent.com",
    clientSecret="${my-secret}",
    redirectURI="https://www.payara.fish/{my-application}/callback",
    scope="email"
)
public class GoogleOAuth2ConfigurationBean {
}
This feature depends on the Payara's Platform Public API. More information can be found here.
Lastly, the Eclipse MicroProfile API has a dedicated API to handle authentication for JAX-RS services based on JSON Web Tokens (JWT). To secure an existing JAX-RS application, the standard security annotation @LoginConfig is required:
@ApplicationScoped
@ApplicationPath("/api")
@LoginConfig(method="MP-JWT")
public class ResourceConfiguration extends Application {}
More information about how the Eclipse MicroProfile JWT Propagation API works on the Payara Platform can be found here.
All of these security features take advantage of the foundation that the Jakarta EE Security API brings to the table and leverages its capabilities to integrate with all the standards mentioned previously. Theoretically, you can use GlassFish to integrate with these services if you are willing to write these extensions yourself, but why reinvent the wheel when they are already present in Payara Platform?
Container and Cloud Deployment
Containers are a must when considering cloud deployments, there's no question about it. And when talking about containers, most DevOps engineers are familiar with Docker in some capacity. Jakarta EE sadly has no official specification standards that illustrate how application servers and deployments should behave in a containerized environment, but this hasn't stopped most certified vendors in providing official Docker images of their servers to assist engineers in their deployments.
GlassFish is no stranger to this concept, either. Docker images for Glassfish 4.x are present in Docker Hub, available for everyone to use them for provisioning purposes. Unfortunately, official support for these images stopped at release 4.1, so there are no supported images for Eclipse GlassFish yet. This means that DevOps engineers will have to factor the creation and maintenance of customized Docker images to launch and deploy their applications on a cloud environment, which is not the ideal scenario.
The Payara Platform offers supported, up-to-date Docker images for its Enterprise and Community Editions. The Community edition images are available in Docker hub for both current Jakarta EE profiles:
Each of these images gets tagged for each corresponding released version, with additional tags for specific JDK 11 compatible images. These images are where the true power of Docker is witnessed, as Java 11 introduced a lot of optimizations at the level of the JVM for applications running in container environments.
Third Party Libraries and Classloader Delegation
Although Jakarta EE is a powerful application development framework, there are occasions when applications require third-party libraries, like Jackson, Google Guava, to leverage features not present in a standard specification or older versions of existing API implementations (like Jersey, Weld, etc.) needed to make legacy applications work. This results in applications shipping with specific versions of these libraries which can conflict with the same libraries included in the classpath (or module path) of an application server's runtime.
Both GlassFish and Payara Server can be affected by this scenario, which is solved by the use of a proprietary feature named classloading delegation that is used to control the order on which classes are scanned by all classloaders present in the runtime when application component makes use of them. Both server runtimes can toggle this mechanism ON or OFF to allow classes in third-party libraries to be scanned first. To disable classloading delegation for a web application deployed in GlassFish, you have to make it explicit in the glassfish-web.xml deployment descriptors' configuration:
<?xml version="1.0" encoding="UTF-8"?>
<!DOCTYPE glassfish-web-appPUBLIC"-//GlassFish.org//DTD GlassFish Application Server 3.1 Servlet 3.0//EN""http://glassfish.org/dtds/glassfish-web-app_3_0-1.dtd">
<glassfish-web-apperror-url=""><class-loaderdelegate="false"/></glassfish-web-app>
The same applies for the Payara Platform (which supports classloader delegation at the EAR's level). What happens when you need more control? For example, imagine that you want the runtime's classloader to scan a set of classes and read others from the pre-defined order established by the classloader delegation. As there's no way to do this on GlassFish the Payara Platform introduced the concept of extreme classloader isolation.
It is possible to instruct the classloader to whitelist specific Java packages (and classes) so that it honours the usual classloading delegation on all classes that belong to any whitelisted package BEFORE it considers the packages in third-party libraries available in the application's classpath. To do this, you'll have to declare these packages using the payara-web.xml deployment's descriptor:
<?xml version="1.0" encoding="UTF-8"?>
<!DOCTYPE payara-web-appPUBLIC"-//Payara.fish//DTD Payara Server 4 Servlet 3.0//EN""https://docs.payara.fish/schemas/payara-web-app_4.dtd">
<payara-web-app error-url=""><whitelist-package>com.google.guava</whitelist-package>
<whitelist-package>com.fasterxml.jackson</whitelist-package>
<whitelist-package>com.sun.faces.spi.FacesConfigResourceProvider</whitelist-package></payara-web-app>
You can read more about this feature in the official documentation.
Migrate to Payara Server Enterprise
Hopefully, all scenarios described previously helped you understand the features that you are missing if you are struggling with these situations by using Eclipse GlassFish. Keep in mind that these are common scenarios, so there are many other features and improvements that Payara Server has over GlassFish that were skipped in the article!
This should give you some motivation to migrate from GlassFish to Payara Server Enterprise for your mission critical production environments to take advantage of the included support services, stability, and security.

Related Posts
The Payara Monthly Catch - August 2025
Published on 02 Sep 2025
by Dominika Tasarz
0 Comments
Welcome aboard the August 2025 issue of The Payara Monthly Catch! With summer in full swing, things may have felt a little more quiet across the Java world - but certainly not less interesting! We hope you managed to get some rest and recharge, ...
The Payara Monthly Catch - July 2025
Published on 31 Jul 2025
by Chiara Civardi
0 Comments
Your Round-Up of the Latest Java & Jakarta EE News.
Welcome aboard the July issue of The Monthly Catch. As always, we’re bringing you the latest updates, product news and expert resources from across the Payara ecosystem.
This month, we’re ...