
Search Results for “monitoring console”
-
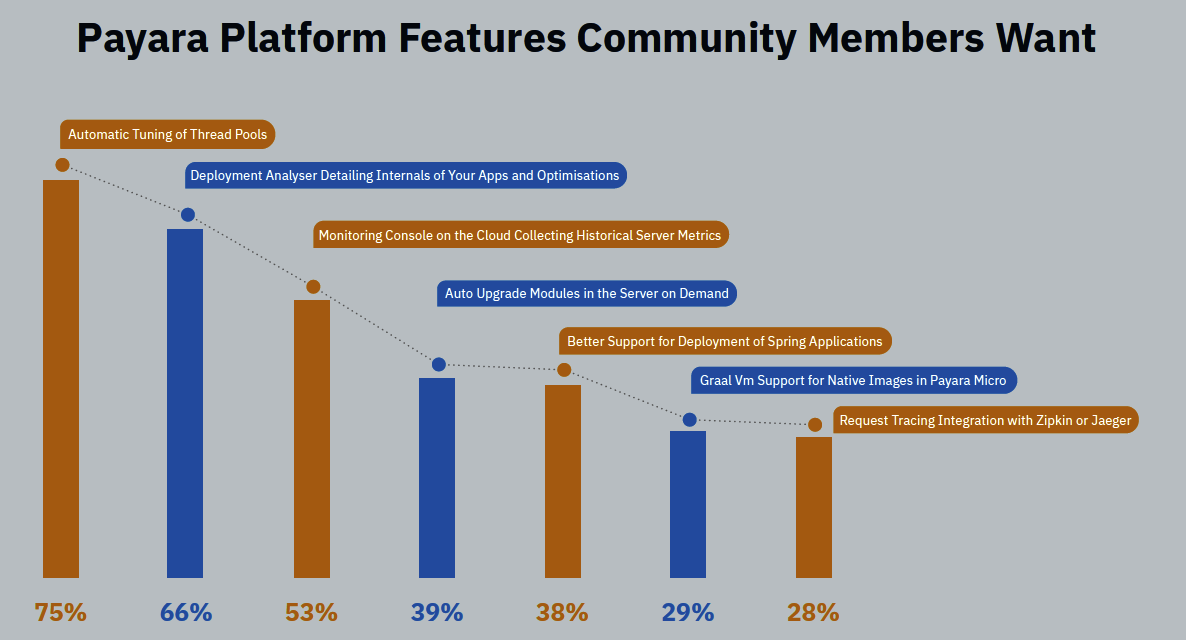
Payara Platform 2019 Community Survey Results We learned that the most popular feature the community wants to see in a future release of the Payara Platform is automatic tuning of thread pools. People also want a deployment analyser detailing internals of your apps and optimisations and a monitoring console on the cloud to collect historical server metrics.
-

6 Reasons to Choose Payara Server Instead of WebLogic Server in production. But you do not need to rely on an external system for the monitoring of the application in Payara Server. Starting from version 5.194 you also have the Monitoring Console available within Payara. This gives you all the monitoring information from within the server itself and therefore...
-
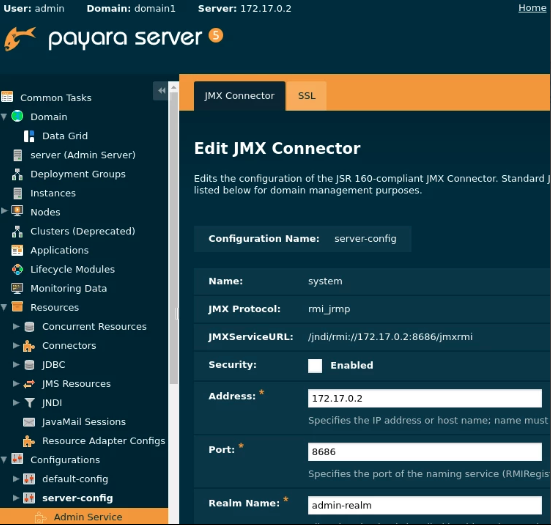
How and When to Disable Domain Data Grid in Payara Server You can also disable it using the Admin Console by selecting the Data Grid item within the server-config element.... The Domain Data Grid is also one of the storage options of the persistent EJB timers. The option is still shown in the Admin Console when the Domain Data Grid is disabled, but this will no longer work and results in an error when the systems tries to use it. If you disable the Domain Data Grid, you'll need to store it in a database instead.
-

What's New in Payara Server 5.194? ます。以下のコマンドで有効化できますのでお試しください。 asadmin set-monitoring-console-configuration --enabled true Dockerインスタンス 自動的にスケールするdockerインスタンスのサポートを実装しました。そのため、素のdockerコマンドだけでなく、DASからもdockerインスタンスが作成可能となっています。インスタンス名は自動的に生成することができます。 デプロイメント・グループ start-deployment-groupコマンドにinstanceTimeoutパラメータが追加されました。同時に、Management... asadmin set-monitoring-console-configuration --enabled true...
-
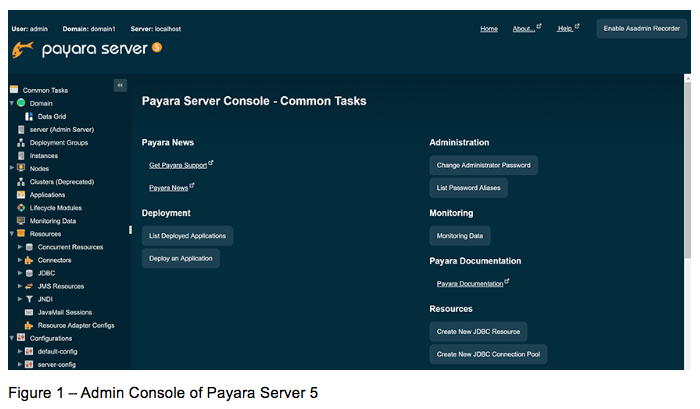
Basics of Payara Server Admin Console - #1 Overview and Concept This is the first article of “Basics of Payara Server Admin Console” blog series. I’ll explain how to use Admin Console of Payara Server in this blog series. In this article, I’ll explain the concept of Admin Console and its role in Payara Server, which is important before you start using the Admin Console.... First, start Payara Server and open http://localhost:4848/ on your Web browser. The Admin Console main page will load as in Figure 1.
-
Payara Platform Enterprise 4 Lifetime Support 2025 Payara Server Enterprise’s Health Check, Notification Server, and Request Tracking monitoring and alert tools... Payara Server Enterprise’s Payara Insight monitoring console that enables you to see real-time graphics with daily metrics, including app metrics... Consult our EcoSystem Catalog for a full list of Build Tools , Cloud Connectors , Cloud Providers , Clustering Tools , Container Technology , Distributed Tracing , Jakarta EE Resource Adapters , Monitoring tools, Security Protocols , and Testing Frameworks to ensure when you’re migrating that the Payara Platform will fit into your existing infrastructure...
-

Payara Platform Roadmap for 2019 During 2019, we will be building deep integration with public cloud providers APIs enabling Jakarta EE developers to build applications that work well in Microsoft Azure, Google Cloud Platform, AWS and others. We aim to deliver support for key enterprise services like Security, Messaging, Integration, Monitoring and Persistence across the main cloud platforms integrated to the Payara Platform.... Throughout 2019 we will continue the good work of 2018 and track and release MicroProfile support on both Payara Server and Payara Micro. We will also integrate these APIs deeply with our runtime to give deep support, manageability and monitoring for applications using these APIs. We envisage...
-
Monitoring Payara Server with JConsole JConsole is a useful tool for monitoring Java processes. You can collect data from a Java process such as: heap memory usage, thread count, CPU usage, classes loaded and MBean data. This allows you to gauge whether any Java process is using too much system resources. This guide will show you how to monitor Payara as a local process (on the same machine), or a remote process. This blog will assume that you've got a valid JDK and Payara install.
-
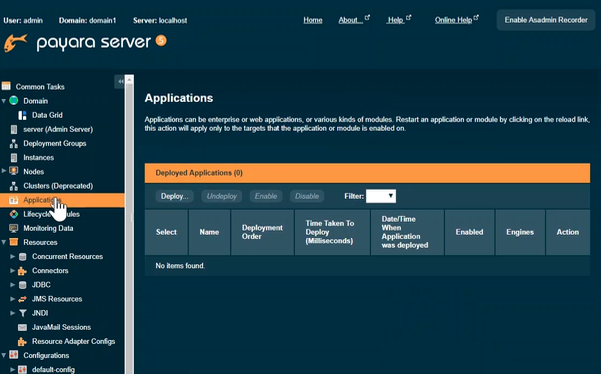
Deploy Applications Using Payara Server Admin Console In this blog, I will explain how to deploy applications using the Payara Server Admin Console. You can also watch this super short video (under 2 minutes) to see how to deploy applications using NetBeans, the Payara Server Admin Console, or using admin commands. Here’s how to deploy and undeploy... applications with the Payara Server Admin Console: Use the Deploy Applications or Modules page to deploy an application. Click “Applications” on left side of Admin Console to open the page. Next, click “Deploy” button to deploy an application. The Deploy Applications or Modules page contains...
-

How to Join Payara Micro Instances to the Data Grid in the Admin Console Payara Micro instances can join a cluster automatically. They could also join the Domain Data Grid as well as standalone Payara Server instances. In this blog, I explain how to join Payara Micro instances to the Data Grid in the Admin Console. Prerequisites First, we need to run the Payara Server... the other options, we would set them (e.g. “--deploy”, “--autobindhttp”) on demand as usual. When the Payara Micro instance is running, the status is listed on “Data Grid Instance” page in Admin Console (figure 1). We could confirm its location, listen port, deployed applications and other information...