
Originally published on 02 May 2019
Last updated on 20 Dec 2023
This is the first article of “Basics of Payara Server Admin Console” blog series. I’ll explain how to use Admin Console of Payara Server in this blog series. In this article, I’ll explain the concept of Admin Console and its role in Payara Server, which is important before you start using the Admin Console.
First, start Payara Server and open http://localhost:4848/ on your Web browser. The Admin Console main page will load as in Figure 1.
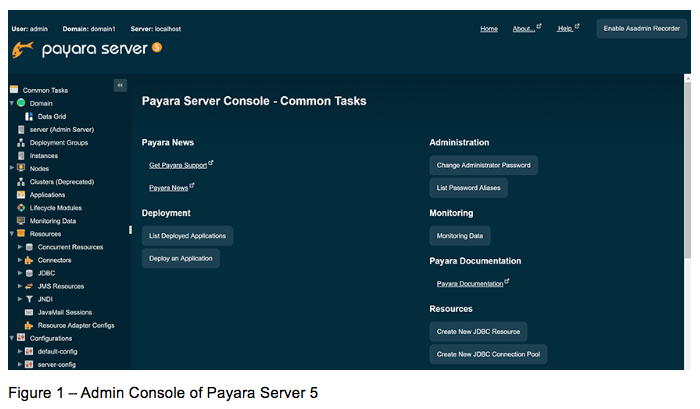
By default, the Admin console doesn’t require authentication and doesn’t allow remote access over network. If Admin console is secure with a password, it will first prompt for a user and password before loading the main page. You can do almost all of administration for Payara Server using Admin Console.
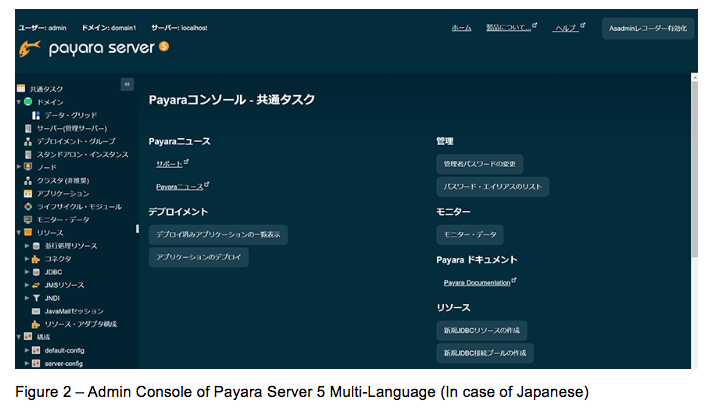
If you use Multi-Language distribution of Payara Server, Admin Console will be localized by the language settings of your OS. For example, you can see Admin Console when running in a Japanese environment in Figure 2.
Admin Console consists of three parts – “Header”, “Left Pane” and “Right Pane”.
The “Header” has various information about Admin Console. There is the “Asadmin Recorder” button that records user operations on Admin Console and write them as a script for asadmin command. See also Payara Server Documentation for details about Asadmin Recorder.
The “Left Pane” lists components and services that are available in Payara Server. To administrate Payara Server, you need to change settings of components or access services. The targets are aligned in the “Left Pane”.
When you choose a component or a service in the “Left Pane”, its detail is shown in the “Right Pane”. If you want to change settings of a component, select it in the “Left Pane”, change settings in the “Right Pane” and save them with the “Save” button in the “Right Pane”.
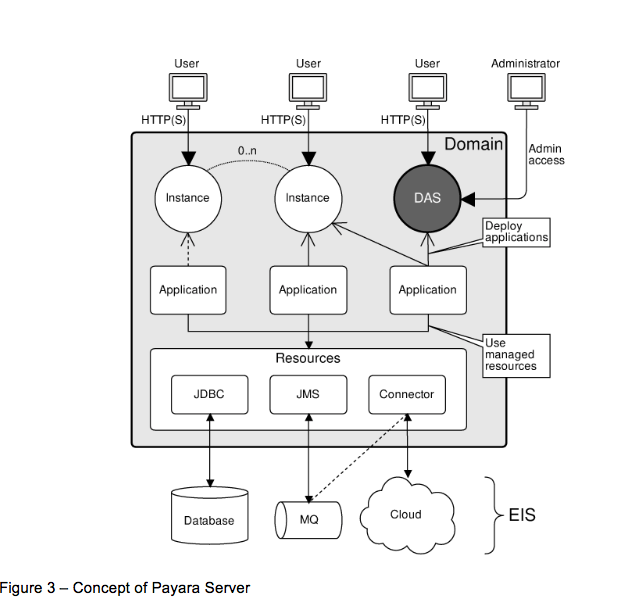
Each item of the “Left Pane” is aligned with the architecture of Payara Server. Thus, it’s important for you to understand this architecture before using Admin Console. In this article, I choose some important items and will explain their concepts.
I describe concepts of Payara Server in Figure 3. Each item of this chart represents an item which has the same name in the “Left Pane” in the Admin Console.
Domain
“Domain” means a runtime environment of Payara Server. It is a collection of configurations and includes instances, applications, resources, etc. A domain is controlled by the special instance named Admin Server (DAS). You can have multiple domains in Payara Server installation but only one of them can be used to start Payara Server and the whole runtime environment associated with it (e.g. instances, a JMS broker, an embedded database, etc.)
To start Payara Server with all its domain runtime environment, you would use “asadmin start-domain” command. By default, Payara Server is started with the domain called “domain1”. You can specify another domain with an argument to the “asadmin start-domain” command.
Instance
“Instance” is a JVM process as a part of Payara Server. It is actually a server that can run applications. There can be multiple instances running within a single domain, either listening on different ports on the same machine or running on multiple machines. An instance includes the following things:
l component configurations
l shared resources
l Application deployment area
l Server configuration settings
Payara Server’s “Domain” has always at least one instance which is called “Admin Server (DAS)” and controls the whole Domain. In the Admin Console, you can find it in the “Left Pane” under “server (Admin Server)”.
If needed, additional instances can be configured in the Admin Console with “Instances” in the “Left Pane”. These instances are often called “standalone” to distinguish them from the Admin Server instance and from cluster instances that exist in Payara Server 4 but no longer exist in Payara Server 5.
Application
“Application” means a server-side Java application, which is created using any supported APIs (e.g. Jakarta EE), packaged in a supported format (e.g. WAR, EAR) and may use shared resources provided by the server. (e.g. JDBC Resource for access to a database)
“Deploy” is an action that installs the application in Payara Server and sets it up so that it can be accessed of the server. Applications can be deployed to any number of instances, including the Admin Server.
Resource
“Resource” provides connectivity to external systems (EIS). Each application may use Resources as available in the server. Resources are shared by all applications and all instances. Resources can be accessed via a JNDI lookup or injected into applications. Payara Server provides the following resources:
- JDBC Resources and Connection Pools for database access
- JMS Resources for asynchronous messaging
- JavaMail Sessions for STMP server access
- Connectors for external system connections (e.g. Asynchronous messaging service provided by cloud service)
- Concurrency Resources
“Concurrency Resources” do not provide a connector to an external system but to the internally managed executor services in Payara Server for using multi-thread process in applications.
Monitoring
“Monitoring” means reviewing runtime status of components and services of Payara Server. Admin Console provides direct access to the data from the monitoring service via a simple viewer. However, in many cases, external monitoring tools need to be able to access the monitoring data. One of the options is to connect via JMX to the Payara Server AMX extensions. JMX is a standard Java monitoring protocol defined by JSR 77 (J2EE Management API) feature. AMX are Payara Server extensions to the standard JMX beans provided by each JVM.
In AMX, there are probes managed as tree structure by Tree Node API in Payara Server. Each probe is give a dotted name which looks similar to an internet domain name. You don’t see the internal structure of monitored probes in Admin Console. But you could use any JMX client to see that the monitoring probes are managed as a tree structure internally.
Configuration
“Configuration” is a data set which determines how Payara Server should operate. In particular, there are following items to configure:
- JVM settings and system properties
- Logging and Monitoring settings
- Web/EJB container and thread pools settings
- Security and Availability settings
Configuration settings are also managed in a tree structure internally, similarly to the monitoring data.
Wrap Up – Basic Administration Tasks
There are a lot of operations to administrate Payara Server. The most basic and typical operations are:
1. Configure Domain and Instances
2. Deploy Applications and Resources
3. Monitor Server – Instances, Applications, Resources, etc.
4. Review all of the above in a read-only manner
In the next article of this series, I will explain operations which you can perform in the Admin Console.
You might also be interested in this resource:
How to Use the Admin Console in Payara Server
Related Posts
Installing Payara Server on Mac
Published on 18 Oct 2018
by Rudy De Busscher
4 Comments

Introduction
This blog explains the setup of Payara Server on MacOS systems and how you can define a specific JVM which will be used to run the server.
Session Replication in Payara Server with Hazelcast
Published on 30 Aug 2018
by Matthew Gill
7 Comments

*Note: This blog post is an update to Dynamic Clustering and Failover on Payara Server With Hazelcast, which was written for Payara Server 4.
Introduction
This article continues our introductory blog series on setting up a simple deployment ...