
Originally published on 11 Feb 2020
Last updated on 14 Jul 2021

In Payara Platform 5.194 we introduced the monitoring console. The upcoming 5.201 release now offers numerous improvements and additions. We continued to followed our vision of a monitoring tool that users can configure to their needs, ranging from new tools such as watches and alerts, to new colour themes and settings users can tweak to match their individual preferences.
We also continued the integration with the existing monitoring technology in Payara Server. Further page presets cover health checks and slow SQL tracing. The existing request tracing page has been retrofitted with more information which was made possible by the advancements of our underlying concepts.
Alerts & Watches
An important aspect of monitoring is noticing when the monitored software gets into a degraded or unhealthy state so that counter actions can be taken. Watches and alerts are new concepts in the monitoring console that help users do that. Watches express the conditions under which a metric becomes degraded or unhealthy. The server evaluates watch conditions whenever new data is collected and triggers alerts when the watch conditions that are met. This can be shown both in dedicated alarm lists or tables as well as visualised within affected graphs.
We paid particular attention when building the system to ensure it would support the user with immediate feedback, but without drowning him or her in a flood of alerts. One aspect was to make the language of watch conditions sophisticated enough to express conditions that can avoid flaky triggers, but keep it simple enough to be easy to understand and use. Another aspect was the concept of stateful alerts. Once started, alerts can transition between degraded or unhealthy until they meet a stop condition. As a consequence, the same problem is not reported over and over again, but is instead reported as a single alert that only grows in the amount of detail information available on its progression.
Some watches originate from within the server and are controlled by server configurations, for example - the health checks. Other watches can be added by the user in the monitoring console web-application.
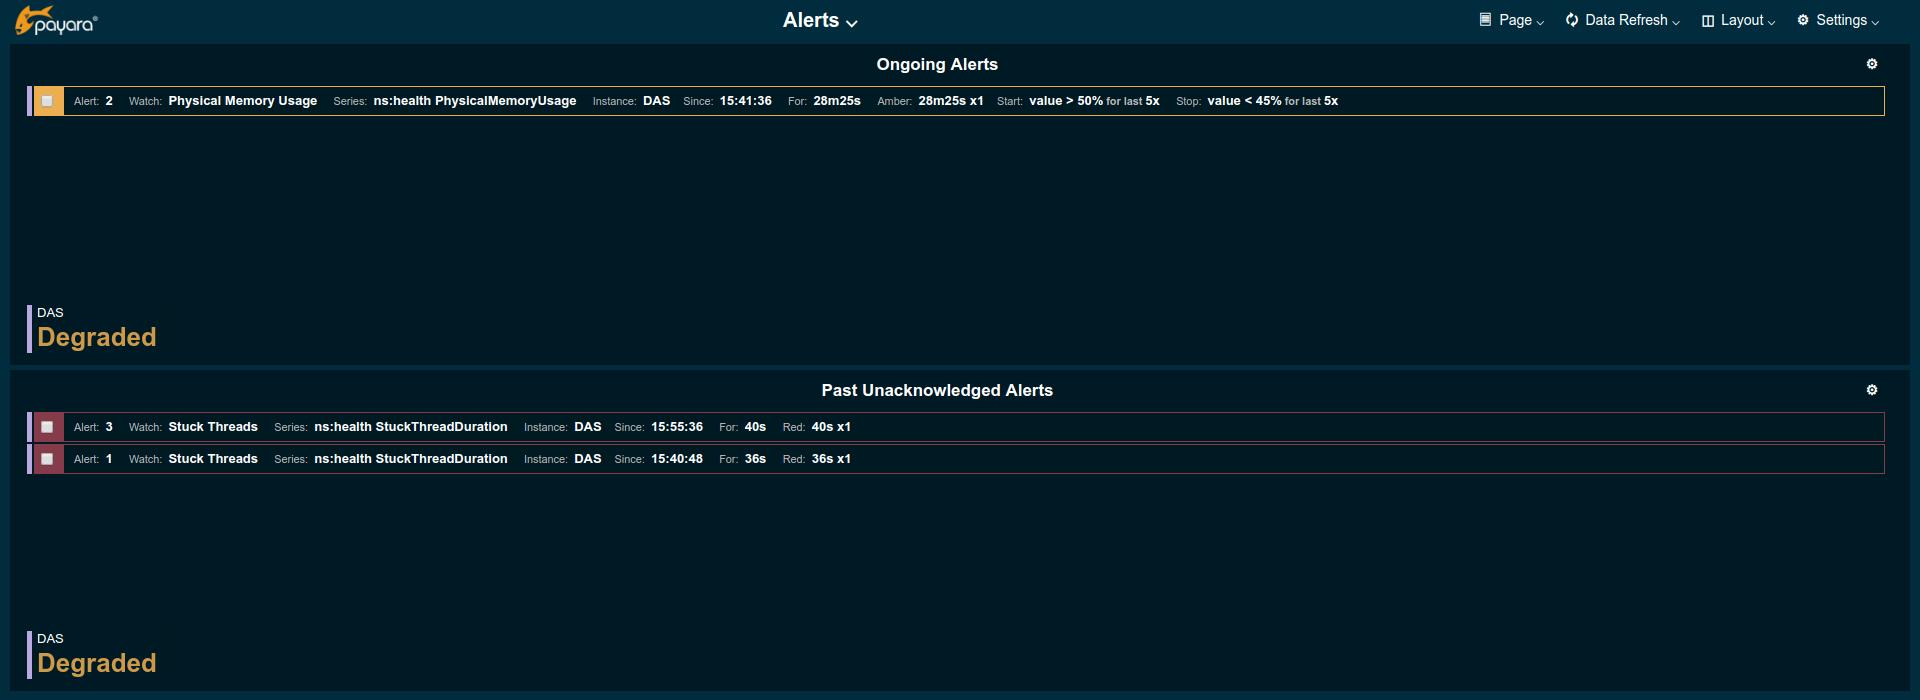
To manage alarms, users can build filtered lists showing only alerts of a certain state or acknowledge individual alerts to move them to another list or make them disappear.
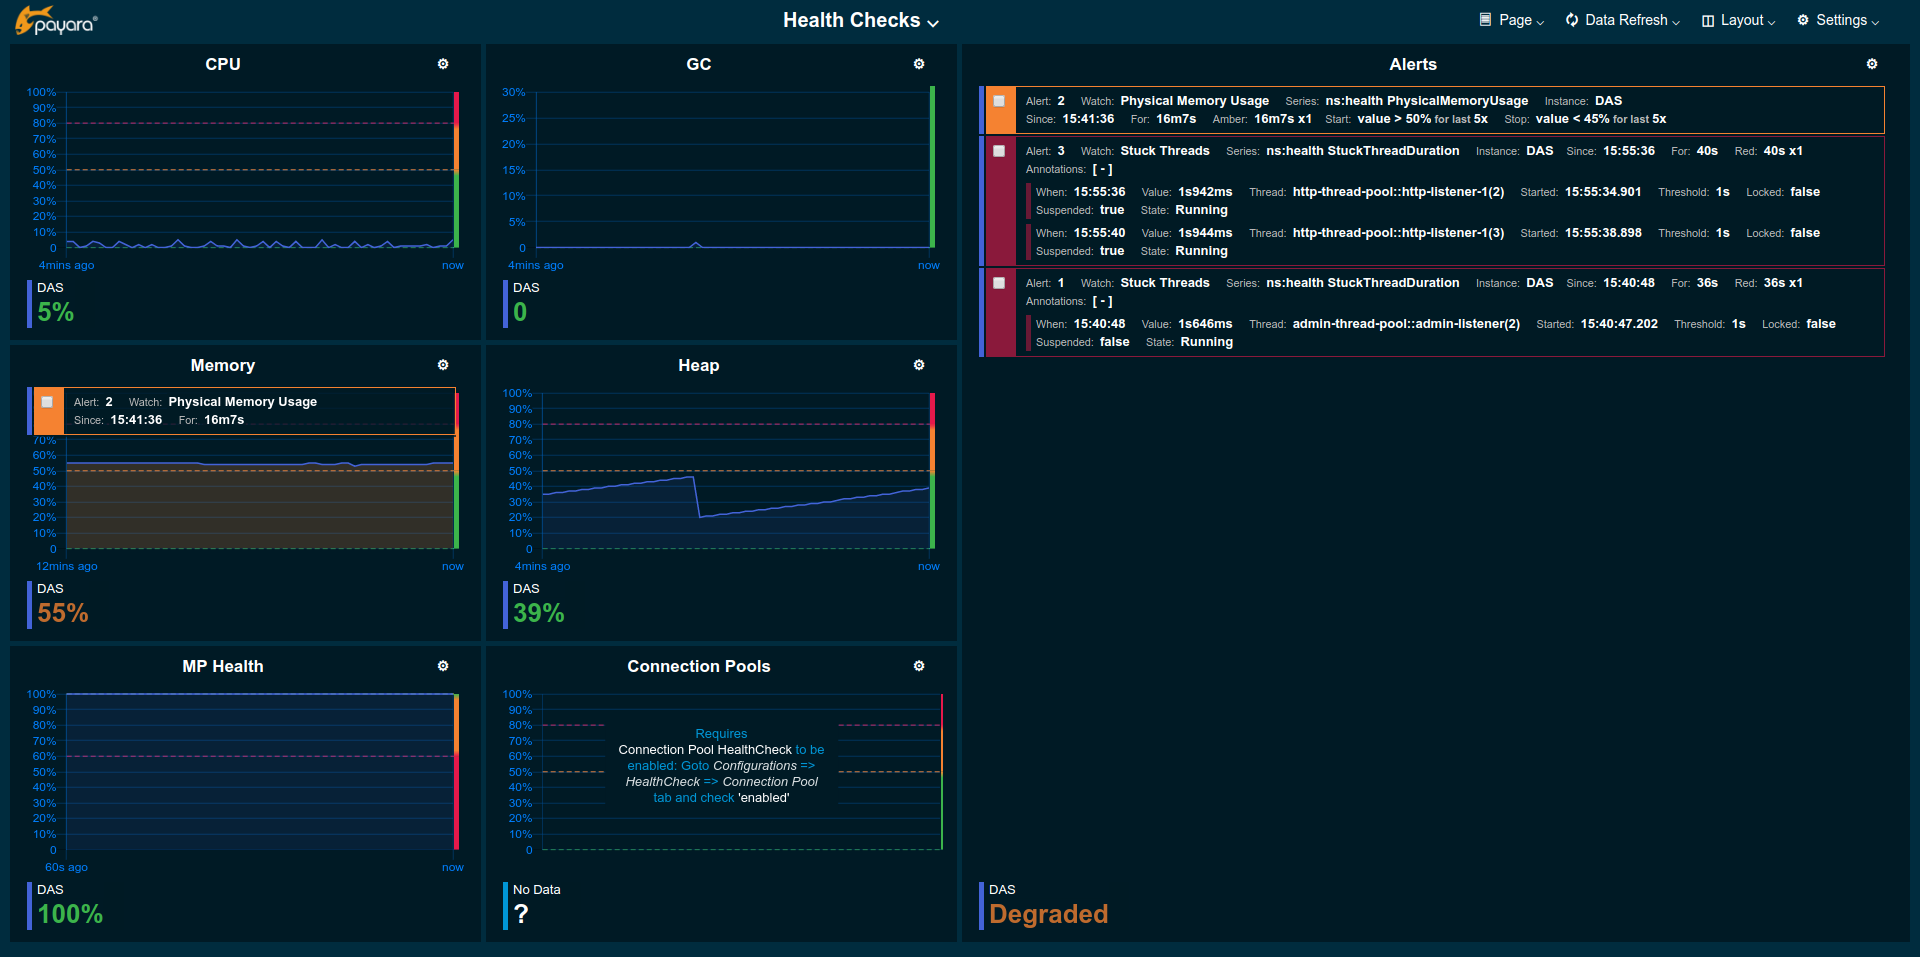
Immediate Health Checks
The existing health checks have been coupled with the new watches & alerts system. When enabling a particular health check in the server configuration, its thresholds are used to create a corresponding watch. This gives the benefits of immediate feedback of the new alerts system and also enhances the visualisation of the checked metric in the graphs on the new health check page displaying the set thresholds.
We decided that the coupling would be active as soon as the individual health check is enabled, but that it would not be required to enable the general health check service so that users can take advantage of the new alerts system without needing to enable the existing health check service with notifications.
Besides the monitored health check metrics, the new Health Checks page also lists all alerts that are related to health checks.
Stuck and Hogging Threads
The health checks on stuck or hogging threads needed special attention as a bare number of threads in such a state alone is not that helpful to localise the problem.
To allow the monitoring console to provide detailed information to events like a stuck or hogging thread, we introduced the concept of data annotations. Those are key-value pairs that are linked to a certain metric at the moment of the event. To prevent uncontrolled memory consumption in case of many events, only a pool of the most recent annotations per metric is kept. These can be shown as lists or tables which is used to show stuck and hogging threads incident lists on the Threads page detailing the identified problems.
Slow SQL
Similar to health checks the existing SQL tracing to identify slow SQL queries was connected to watches & alerts was well as data annotations. The new SQL page lists the details for slow SQL queries and gives insight into SQL execution time and the set thresholds. This equally is controlled by the server's Slow Query Log Threshold setting for each JDBC connection pool. Connected alerts a listed on SQL page as well as the general Alerts page, which shows all ongoing and past alerts.
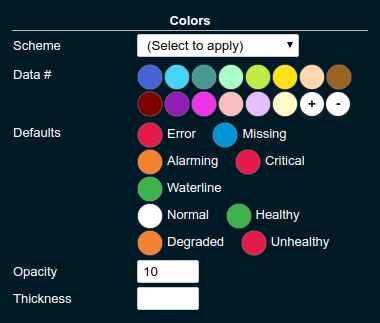
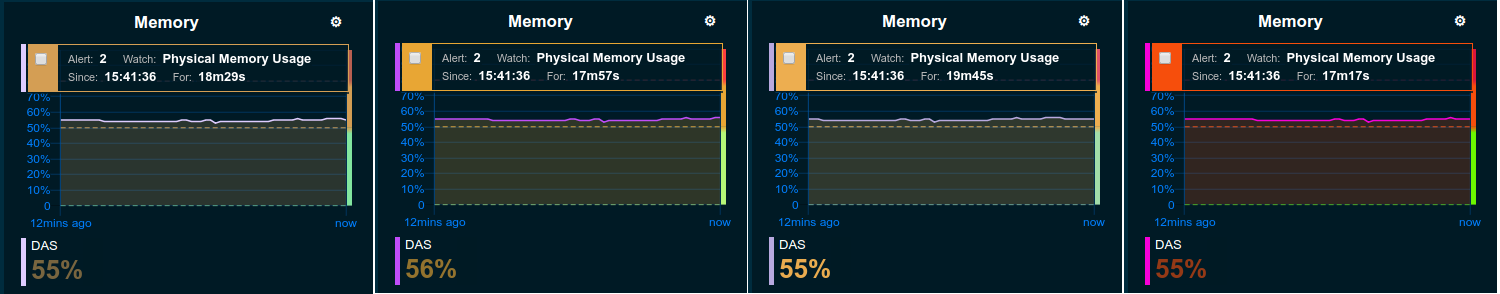
Colour Themes
Along with the functional additions, the monitoring console also got an upgraded appearance. Besides numerous small improvements, a larger addition is the possibility to customise most used colours. The user can choose from a number of predefined colour themes or override any of the theme colours with a custom setting to give the console a personal touch.
Beyond colouration, the user settings now also allows to set a line width for the graph lines to make them as prominent as necessary for the size of screen and screen distance used.
Final Thoughts
This post aimed to give a concise overview of what is coming to monitoring console in 5.201 release (currently scheduled for the end of February). Some of the mentioned additions certainly deserve a more detailed look and feature description. Please let us know what you think, which features we should cover in greater detail, or what feature you would like to see in the future.

Subscribe to the blog to get notified of new Payara Platform releases:

Related Posts
What's New In The Payara Platform September 2025 Release?
Published on 03 Sep 2025
by Luqman Saeed
0 Comments

The September 2025 release marks a significant milestone with Payara 7.2025.1.Beta1 advancing Jakarta EE 11 readiness, alongside focused improvements across Payara Platform Community 6.2025.9, Enterprise 6.30.0, and Enterprise 5.79.0. This ...
The Payara Monthly Catch - August 2025
Published on 02 Sep 2025
by Dominika Tasarz
0 Comments

Welcome aboard the August 2025 issue of The Payara Monthly Catch! With summer in full swing, things may have felt a little more quiet across the Java world - but certainly not less interesting! We hope you managed to get some rest and recharge, ...