
Published on 25 Aug 2020

We have been busy bringing new functionality to the monitoring console. The newest Domain RAG Status feature coming in the August 2020 release offers better integration of the Eclipse MicroProfile Health checks. This article will go into the details of the integration and showcase how it can be utilised in the monitoring console.
RAG Status Page
MicroProfile Health Checks have been accessible using the /health endpoint for a while. This allowed for integration with 3rd party tooling such as those used to setup monitoring. With the newest release of Payara Community 2020.4 in August 2020, such monitoring is now available "out of the box" in the Payara Monitoring Console.
The monitoring console data collection will poll the MicroProfile Health Checks frequently and represent its UP/DOWN status as a metric series available in the monitoring console. It will also place a watch on this metric series and keep an eye on it for you. Should the status change to DOWN, the watch status changes from green to orange immediately. Should the DOWN status persist for a minute, the watch status transitions to red. This produces what we call the RAG (red-amber-green) status that is visualised on the RAG Status page in the monitoring console.
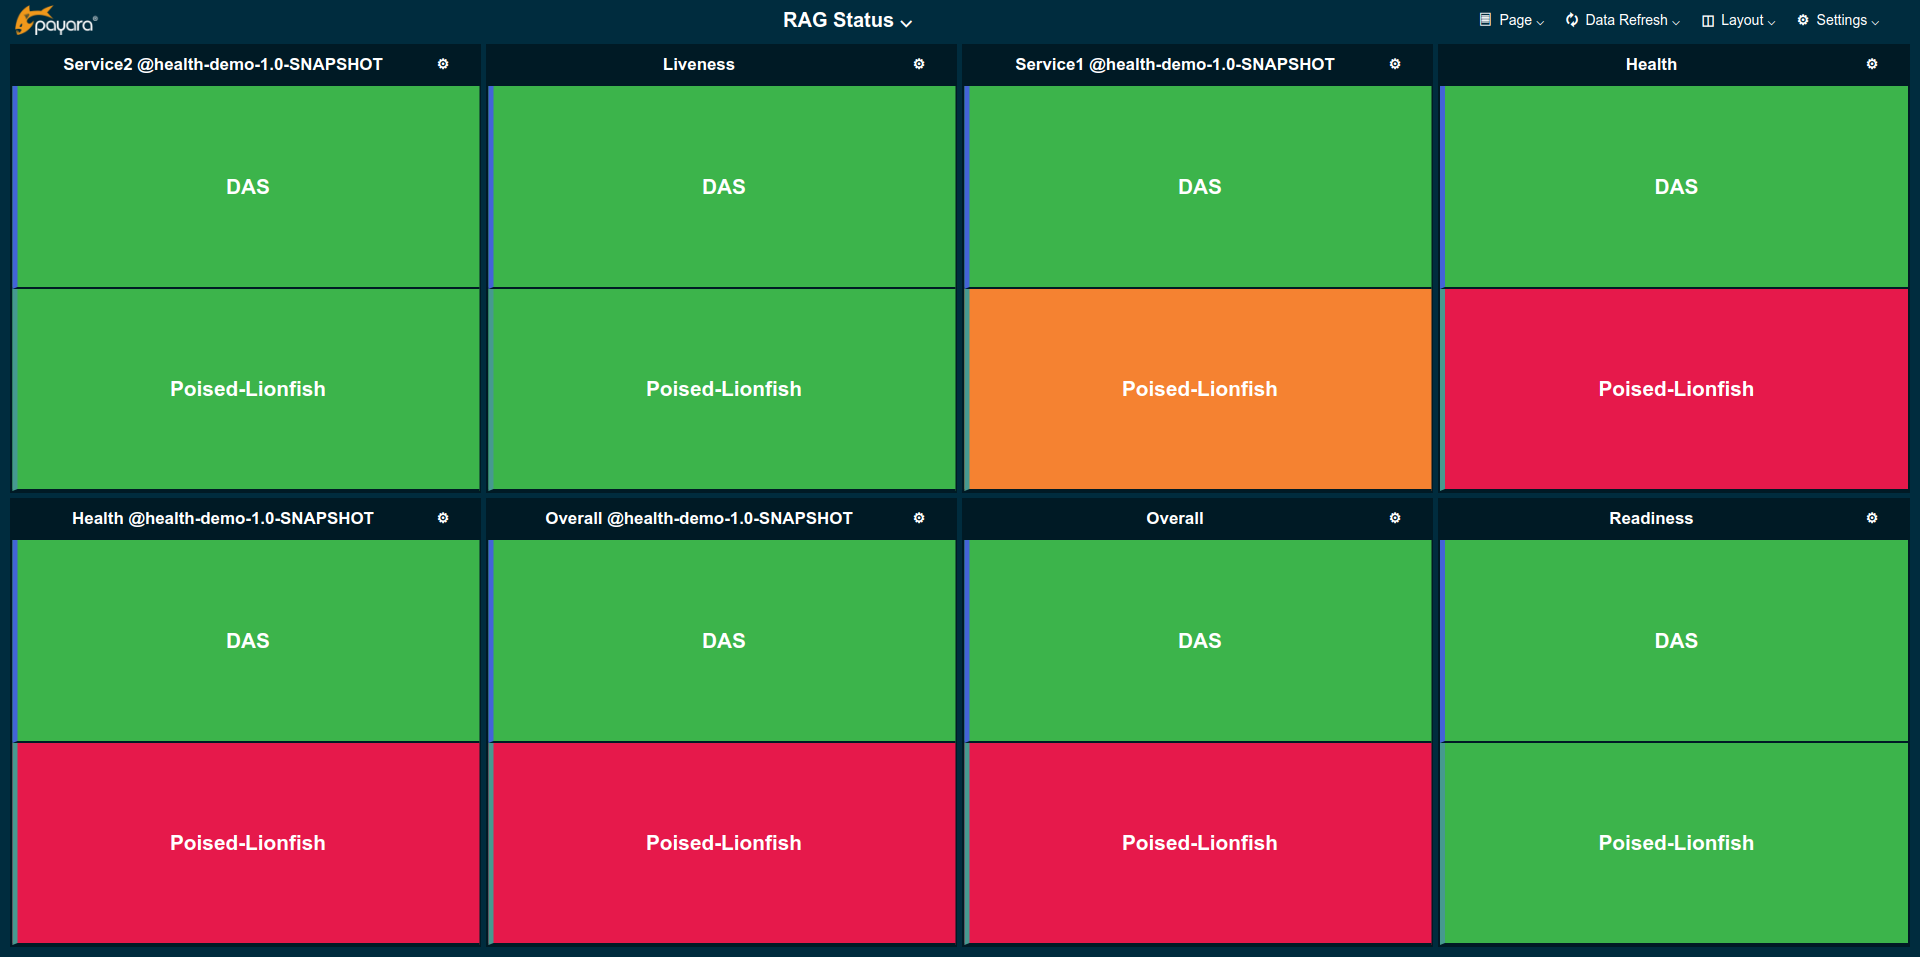
This page shows the health status of each health check and aggregates for each application and health check type as well as an _Overall_ aggregate per application and of the cluster. The above example shows two MicroProfile Health Checks, Service1 and Service2 deployed by the health-demo application. Service1 is DOWN on the Poised-Lionfish instance (orange) which is of type _Health_.
Therefore, the aggregated _Health_ of the application is also DOWN (shown in the above screenshot in red) which also causes the cluster _Health_ to be DOWN (red) as well as _Overall_ (all types per app and cluster) to be DOWN (red) as well. In this example, the aggregates are red as the aggregated status has been DOWN longer then the status of just Service1.
Any MicroProfile Heath Check declared by a deployed application will automatically appear on this page for the instance it is deployed on. It is also automatically included in the aggregates. Declaring a custom health check is very easy using annotations as described in detail in the README of the MicroProfile Health project.
Alerts Integration
Following our philosophy for developing the monitoring console to provide tools for users which can be used and customised to your needs, the integration of MicroProfile Health builds upon existing features in the monitoring console. As the actual monitoring of the health status is performed by watches, the alarms are not just visible on the RAG Status page, but also show up in the Alerts page.
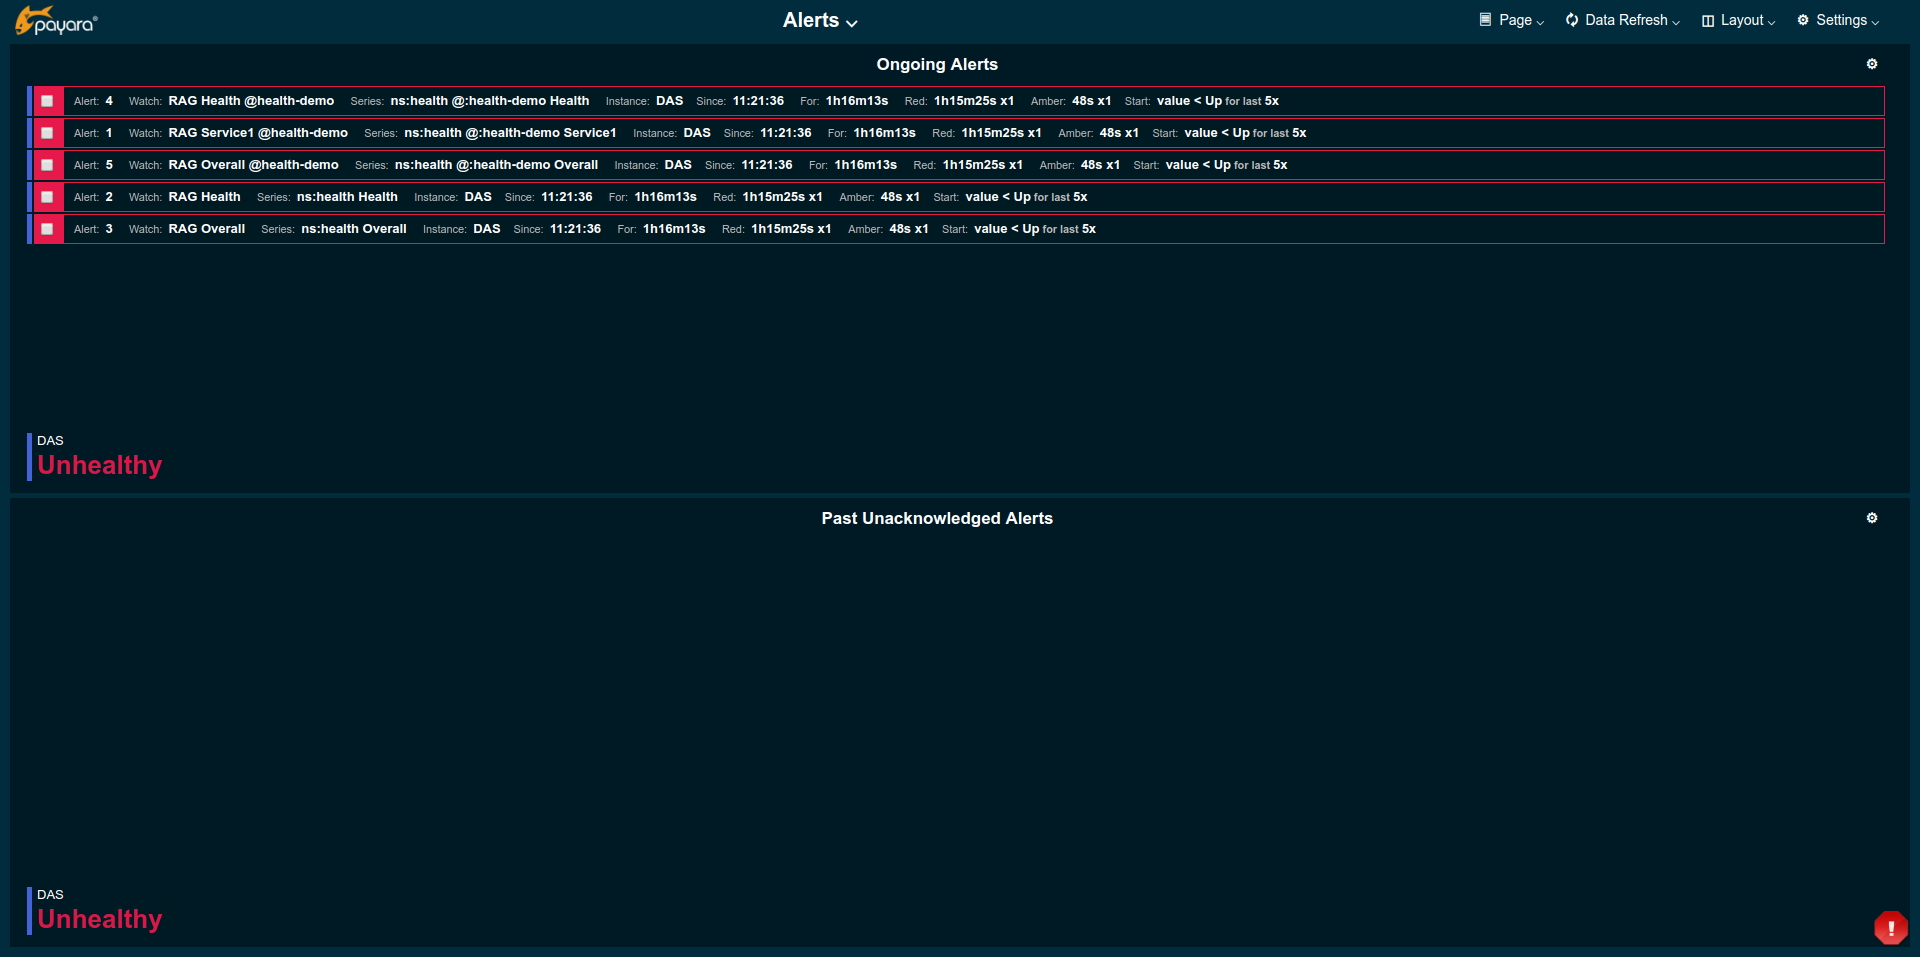
Eventually, existing data provided by the MicroProfile Health Check gets attached to the alerts in form monitoring console data series annotations. This data can be shown in widgets of type Alert or Annotations as in the example below:
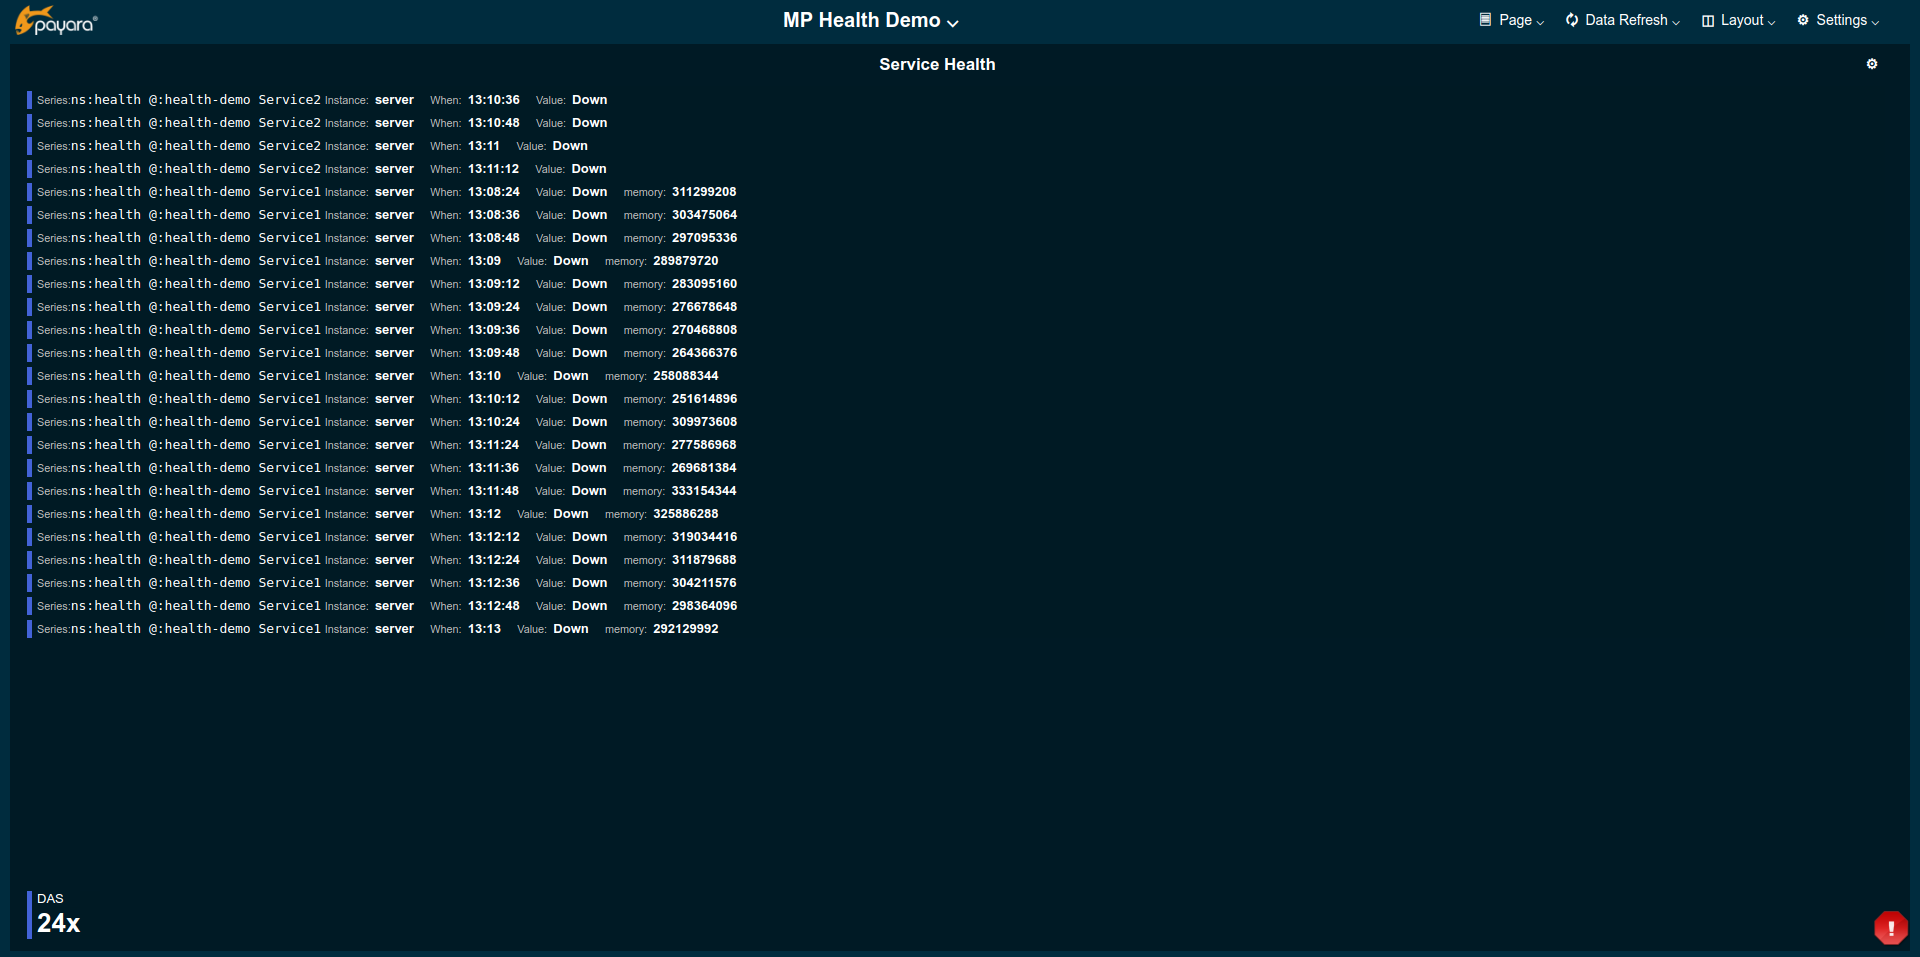
Besides the basic data on the annotation event, this example shows the memory property which got added by the health check.
Investigate the Health Status
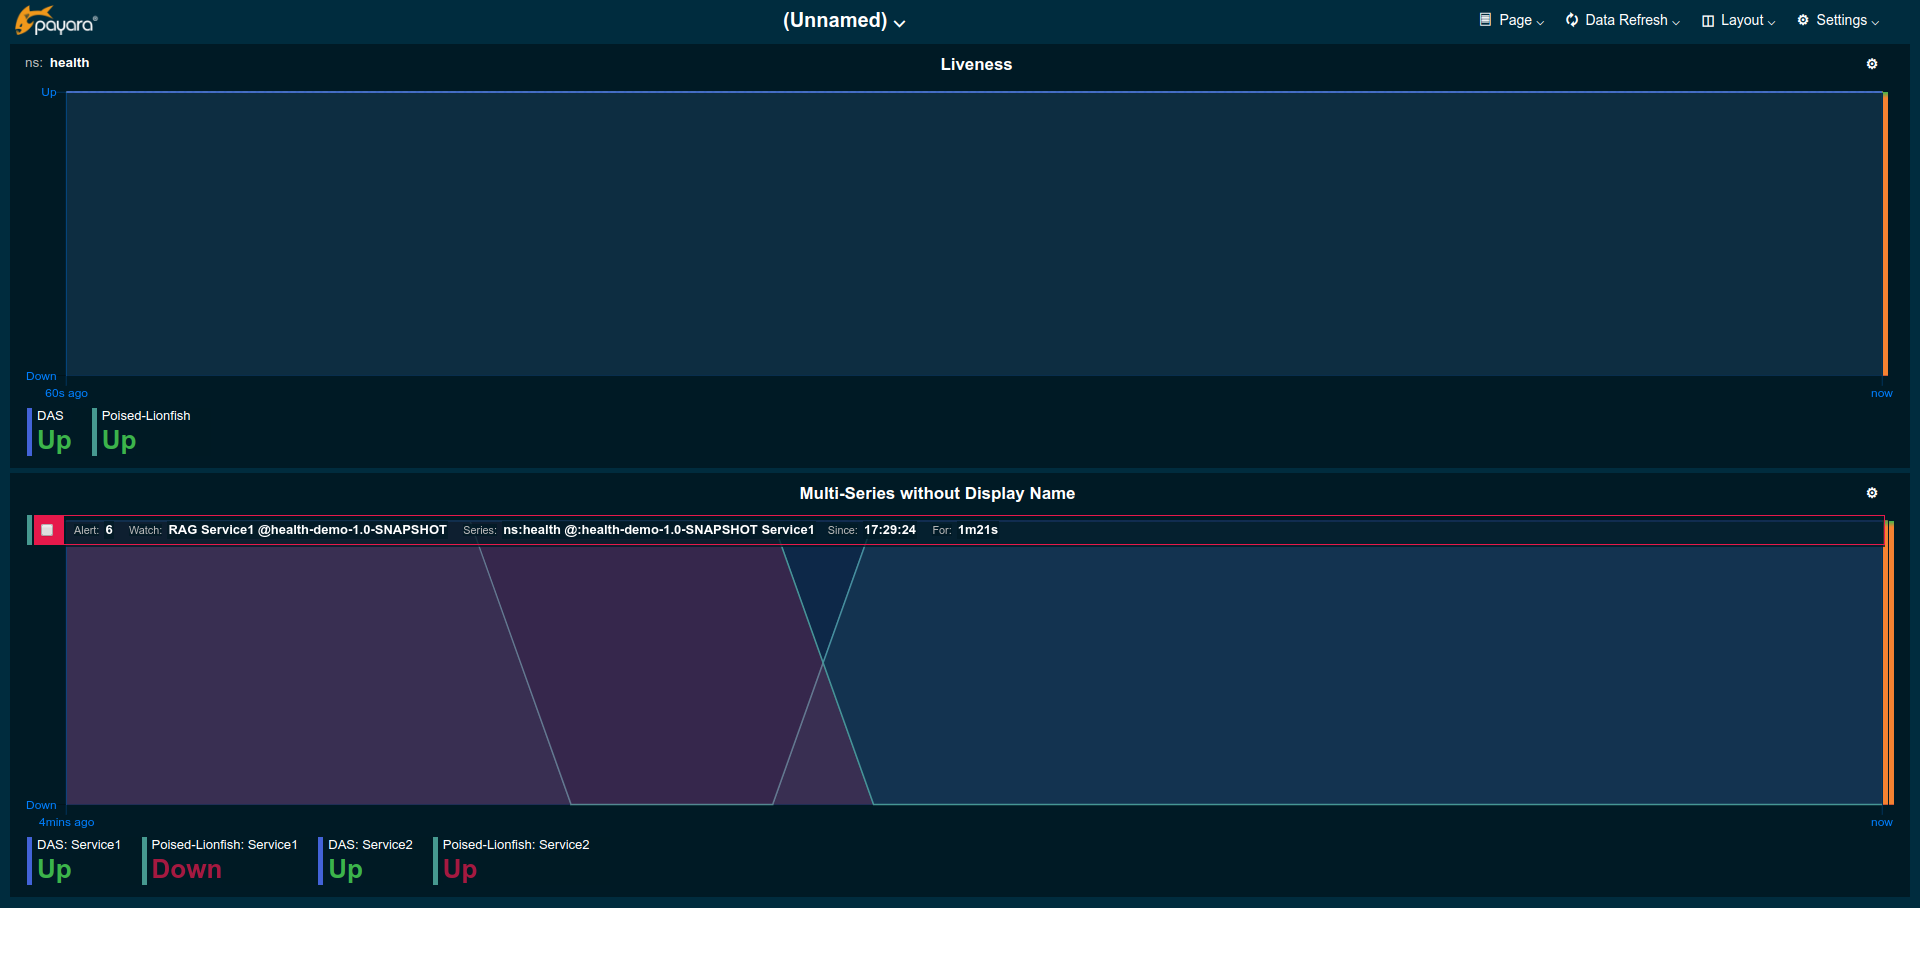
The data provided by the metric series, watches, and annotations can also be used to investigate further. The history of the UP/DOWN status of particular services (health checks) or aggregate series can equally be shown as a line chart. This allows visualizing the change between UP and DOWN on the time-axis. In this example, we created a new page where we added some widgets with series in namespace ns:health. For such manually added widgets, users currently still need to change the Data Unit to Up/Down to customise the labelling from 0/1 to Up/Down.
The below widget in the example shows how the status changed between UP and DOWN, as well as the ongoing alert for one of the series:
Outlook
The foundation for the MicroProfile Health integration is in place. There are some edges we further want to smooth out and as usual we are looking into ideas how to make the integration between the server and monitoring console more user friendly, provide additional tools, and additional methods for visualizing and investigating the state of the server.

Related Posts
Leading the Way: Payara Platform Community 7 Beta Now Fully Jakarta EE 11 Certified
Published on 25 Sep 2025
by Dominika Tasarz
0 Comments

We’re excited to announce that Payara Platform Community 7 Beta application server is now fully certified as Jakarta EE 11 compatible for the Web, Platform and Core Profiles.
This milestone makes Payara the first vendor to achieve full Jakarta ...
What's New In The Payara Platform September 2025 Release?
Published on 03 Sep 2025
by Luqman Saeed
0 Comments

The September 2025 release marks a significant milestone with Payara 7.2025.1.Beta1 advancing Jakarta EE 11 readiness, alongside focused improvements across Payara Platform Community 6.2025.9, Enterprise 6.30.0, and Enterprise 5.79.0. This ...