
Search Results for “monitoring console”
-
Cloud Infrastructures: A Closer Look at What's Available Now and other components needed to build and run applications. An example of such service in the Jakarta EE (formerly Java EE, and J2EE before that) community is our own Payara Cloud, that I like to call 'Payara as a Service'. Monitoring and logging tools are essential components for observing... Monitoring and logging tools are essential components for observing the performance and health of functions within serverless and fully managed infrastructure, as they provide insights into execution metrics, errors and resource utilization. All such services have some form of observability built in.... Explore the differences between serverless, fully-managed, and traditional hybrid cloud infrastructures for software applications...
-
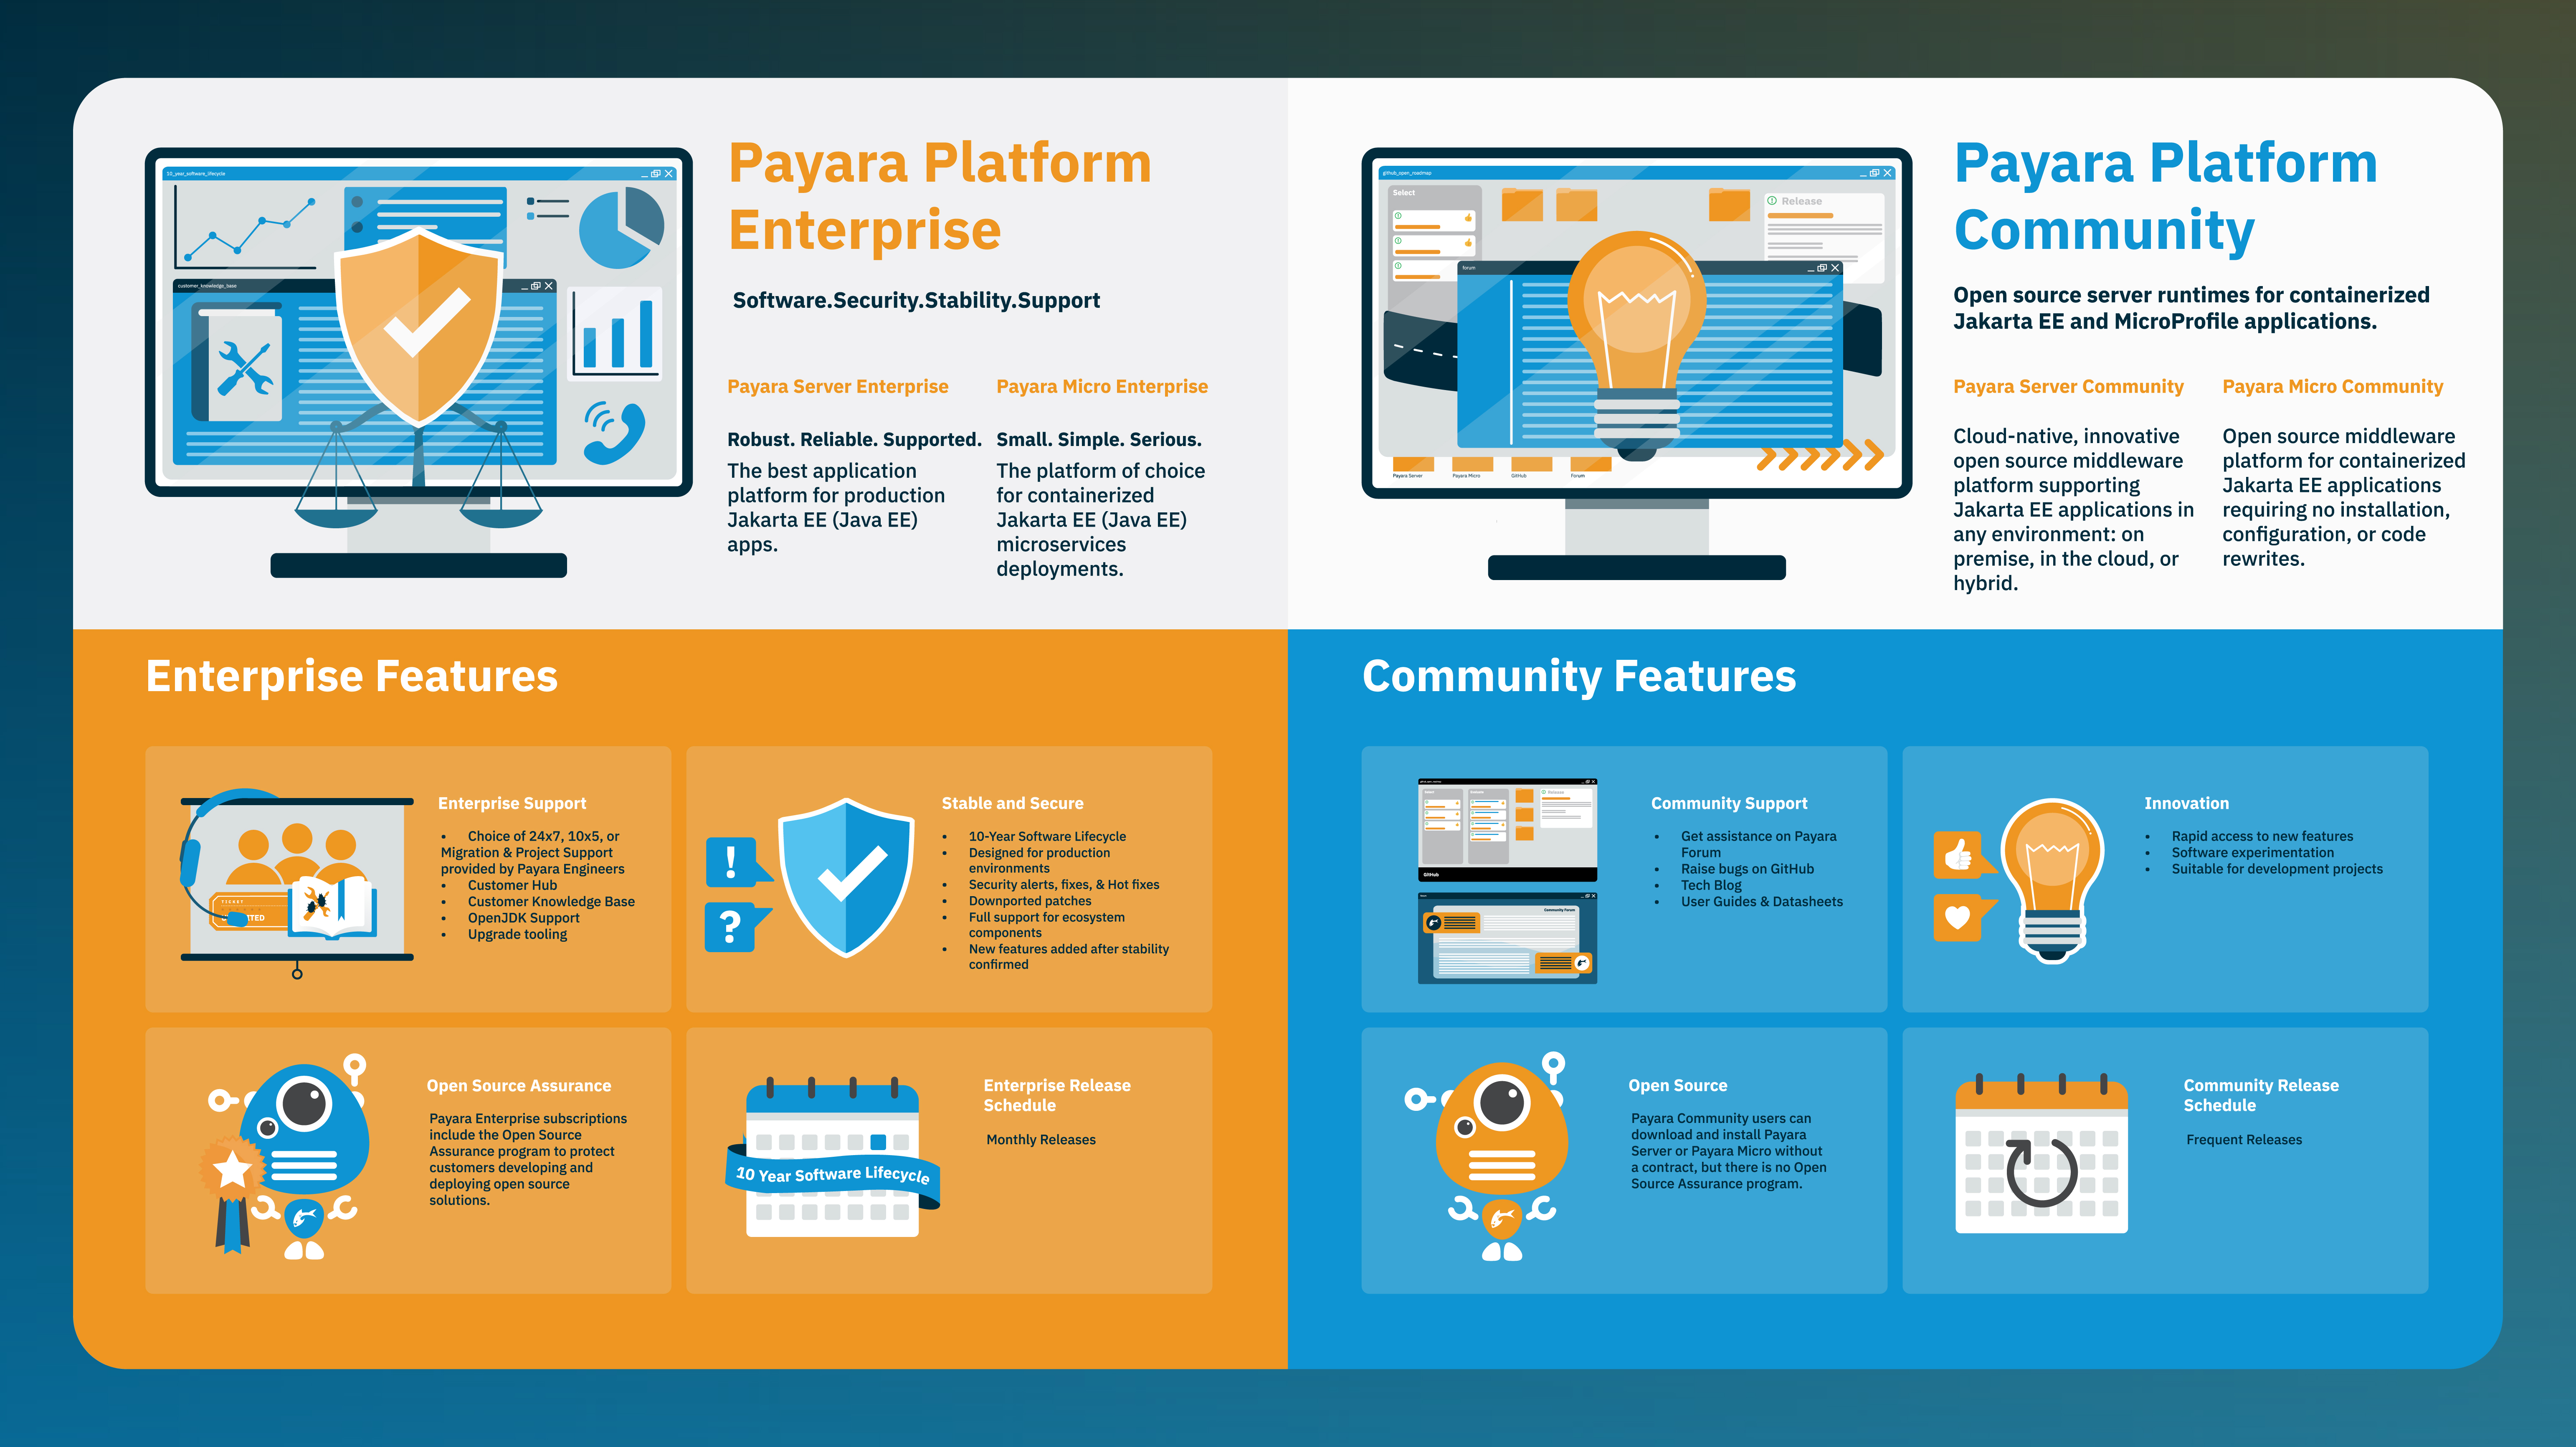
When Is It Time To Move From Payara Community to Payara Enterprise? is at the core of Payara Platform Enterprise, the solution includes advanced security features. These include encryption, authentication, and proactive monitoring. In addition, regular updates and security fixes are released to ensure compliance with regulatory standards. Leading Edge vs. Backwards... As stability for mission critical applications is at the core of Payara Platform Enterprise, the solution includes advanced security features. These include encryption, authentication, and proactive monitoring. In addition, regular updates and security fixes are released to ensure compliance with regulatory standards.... Learn what's the difference between Payara Community and Payara Enterprise and how to choose the right solution for your application...
-

The Payara Monthly Roundup for April 2019 There will be no free public update for either JDK 8 or #JDK 11 from Oracle." By Simon Ritter. Monitoring HTTP Requests with Eclipse MicroProfileIO Metrics - From the always concise, practical and wise Adam Bien. Adopting JakartaEE - Edwin Derks explores why some developers haven't moved on over and explains how... Monitoring HTTP Requests with Eclipse MicroProfileIO Metrics - From the always concise, practical and wise Adam Bien.... A new issue of our monthly roundup where we feature a curated list of interesting articles and videos created by the community that we have enjoyed taking...
-

Tips for Building Cloud-Native Applications provide a lot of monitoring services out of the box, thus making it easy to understand what's going on even in the cloud environment. Distributed tracing of requests between services is remarkably helpful to understand the communication flow between multiple services managed by the cloud. Tip 3... Including: Wide range of cloud-native services. For example, Amazon Web Services is the biggest cloud provider to date, offers more than 100 distinct cloud services, including distributed databases, brokers, routers, and monitoring services. How well are cloud services integrated and easy to maintain...
-

How to Connect Payara to External Hazelcast Grid The Domain Data Grid feature of the Payara products is powered by the Hazelcast library. It provides the necessary functionality for the Deployment Group (clustering functionality), Cache functionality, CDI cluster singleton, and monitoring data storage within Payara to name just a few features.... Here's how to create a Hazelcast grid with the Domain Data Grid that includes Payara instances and instances of applications running outside of Payara...
-
Should you use OpenShift to Run Payara in the Cloud? OpenShiftis a platform that is built on top ofKubernetes. However, while Kubernetes is a software product that you need to install within your current environment, or use with a Cloud provider of your choice, OpenShift is a complete platform itself. Besides Kubernetes, it contains components for integrated networking, storage, monitoring, logging, installation, upgrades, and so much more.
-
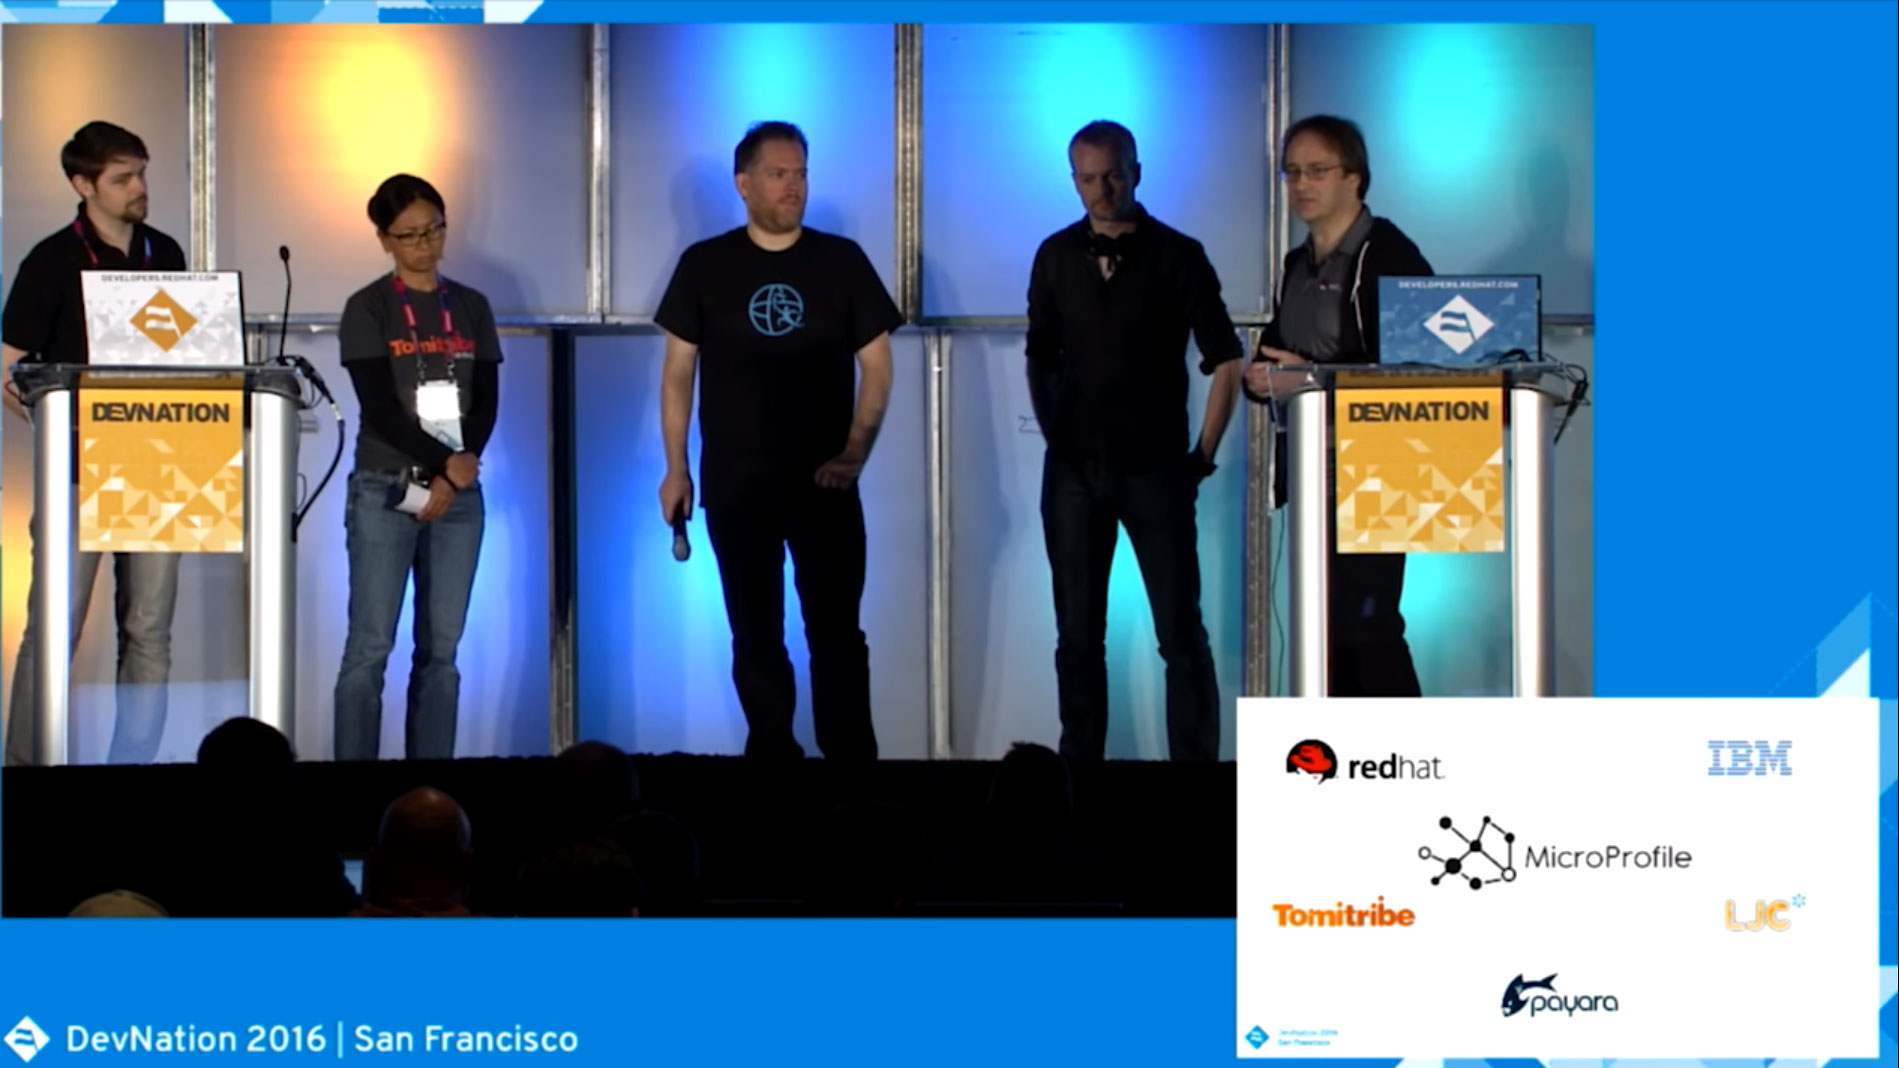
MicroProfile Panel - One Year On of cloud-native tools for monitoring the health of the MicroProfile-based microservices living in the cloud. If you look at it at the macro scale, MicroProfile is shaking hands directly with Container providers, Security solutions and Monitoring systems in the cloud-native space and saying “we... The third are is the emerging MicroProfile Healthcheck specification which mandates standard endpoints and format of HTTP-based healthchecks to determine server status. The goal here is to enable the growing number of cloud-native tools for monitoring the health of the MicroProfile-based...
-

Conf42 IoT 2024: At the Edge of Robotic Applications and their sensors to improve condition monitoring, proactive and scheduled maintenance, supporting remote control, diagnostics and troubleshooting that can help engineers and operators to detect potential issues before they escalate into major problems. As a result, it is possible to reduce unplanned... condition monitoring, proactive and scheduled maintenance, supporting remote control, diagnostics and troubleshooting that can help engineers and operators to detect potential issues before they escalate into major problems. As a result, it is possible to reduce unplanned and scheduled downtime as well as maintenance costs. Even more, data analytics can establish the foundation for highly effective predictive maintenance strategies.
-
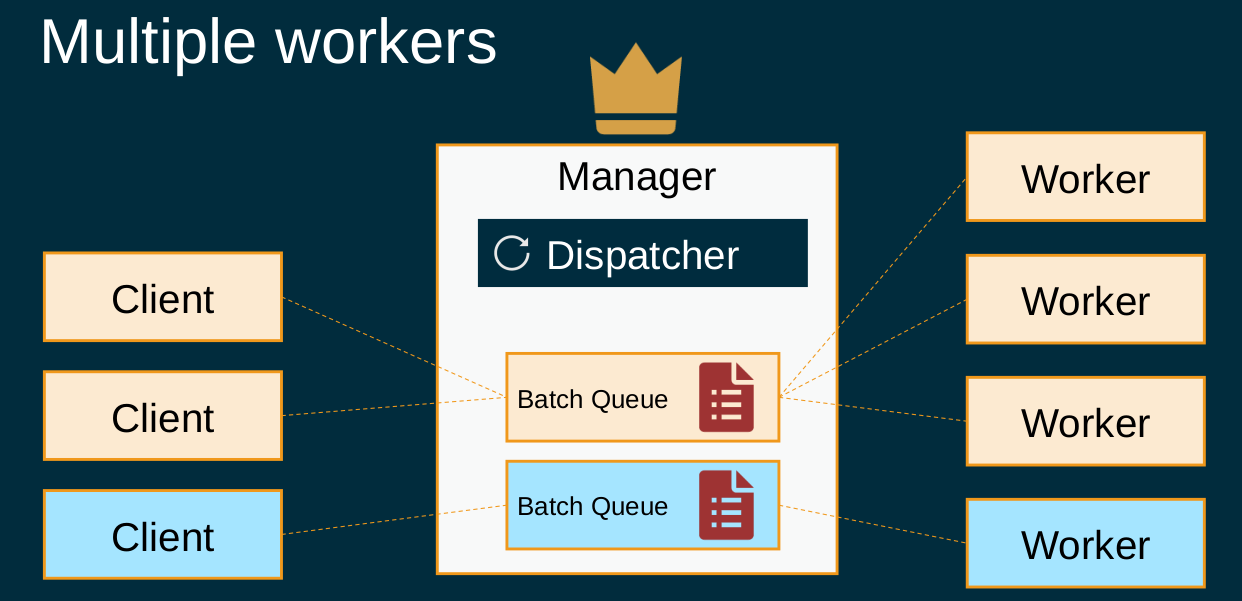
Real-World Use Case: Robust and Flexible Batch Processing with Payara Platform The main application services are running on Payara Server instances, which offer easier access to management and monitoring features. On the other hand, small utility services are designed to be ephemeral, scalable and easily replaceable - so each of these are set up to run on their own dedicated... and monitoring features. On the other hand, small utility services are designed to be ephemeral, scalable and easily replaceable - so each of these are set up to run on their own dedicated Payara Micro runtime to shorten the startup time and decrease the amount of resources that each separate service needs.
-
The Payara Monthly Catch: June 2022 for threads, added to the JDK 19 as a preview feature by the Project Loom project. Jose Paumard explains. Monitoring, Logging, & Alerting In Kubernetes- Viktor Farcic provides his view on the best combination of tools, including Prometheus and Grafana. Java 19 - The Best Java Release? - This Inside Java... Monitoring, Logging, & Alerting In Kubernetes - Viktor Farcic provides his view on the best combination of tools, including Prometheus and Grafana.... Our monthly Java, Jakarta EE, MicroProfile, DevOps and cloud computing news round up of interesting articles, videos, podcasts and community news...