
Originally published on 26 Nov 2019
Last updated on 16 Jul 2021

Payara Platform has implemented MicroProfile OpenTracing with its own tracer that can be sent to other sources via the notification service. But maybe you don't want to use Payara's Tracer, and instead want to use a different one - now you can, starting from Payara Platform 5.194 onwards.
If you wish to use an alternative tracer, you must deploy it as a library to Payara with a file META-INF/services/io.opentracing.Tracer that lists the class name of the tracer to use.
Jaeger Tracing Example
As an example, if you wish to use the Jaeger Tracer you will need a wrapper for it - one is provided at https://github.com/payara/ecosystem-jaeger-tracing. Build the project with mvn clean install and then deploy the complete artifact with asadmin add-library jaeger-tracer-lib-jar-with-dependencies.jar. The JaegerTracerWrapper.java class shows how it is configured.
Configuration.SamplerConfiguration samplerConfig =Configuration.SamplerConfiguration.fromEnv().withType(ConstSampler.TYPE).withParam(1);
Configuration configuration =Configuration.fromEnv("jaeger-test").withSampler(samplerConfig);
This will create a tracer that will trace every request using the name "jaeger-test" when in the Jaeger tracer UI and will send it to a Jaeger collector on the same host (this is the Jaeger default).
Tracing must then be enabled in Payara Server, this can be done with the following asadmin commands:
set-requesttracing-configuration --enabled=true --dynamic=true

bootstrap-requesttracing
To view the results of the trace, a Jaeger collector must available. One can be started easily using docker as follows.
docker run --rm -p 6831:6831/udp -p 6832:6832/udp -p 16686:16686 jaegertracing/all-in-one --log-level=debug
The Jaeger UI is now available on port 16686 on the same host. Going to it will list the available traces, which are under the service name of "jaeger-test" in this example.
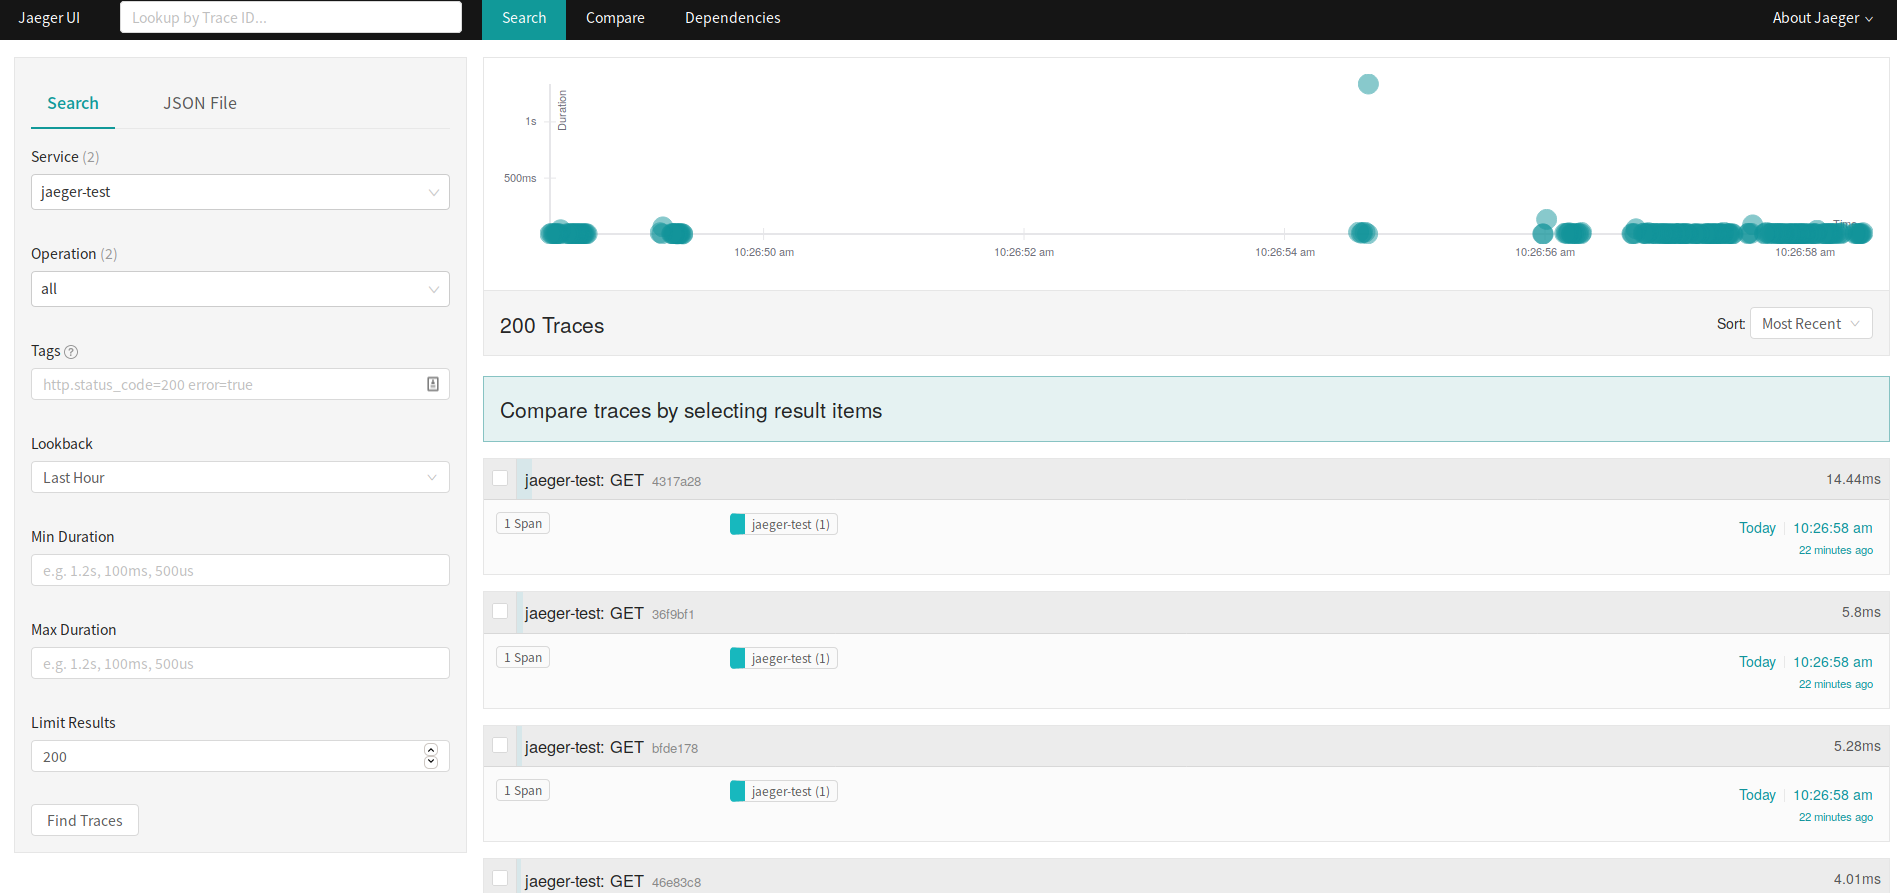
Here you can compare traces or get more details of an individual trace. So in this example, it is obvious that one request took a lot longer than anything else. Clicking on it to find out the details shows:
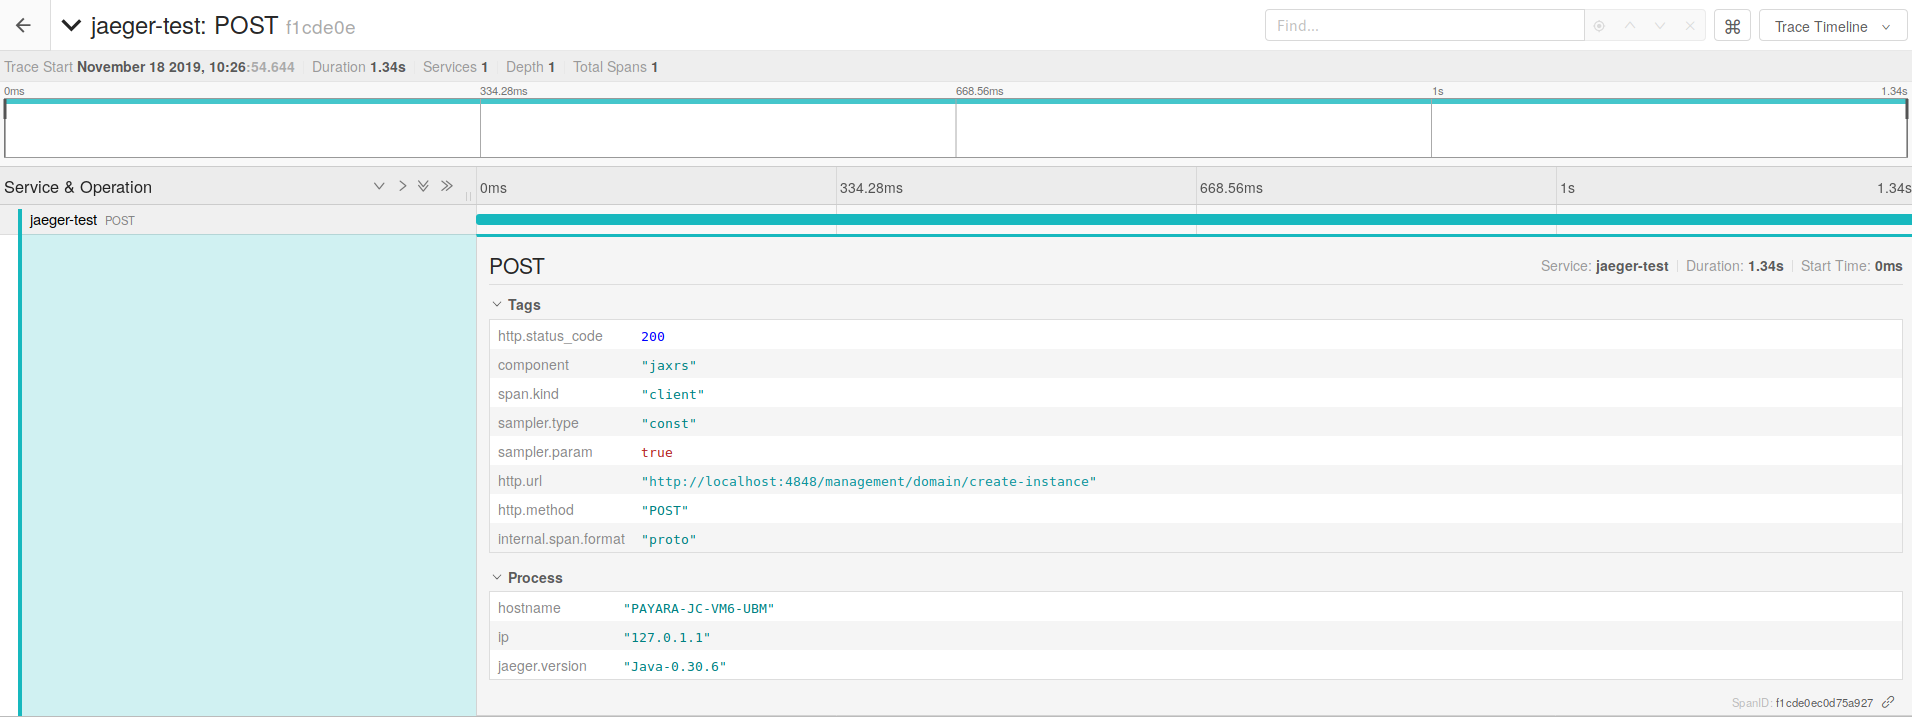
In this case, what took longer was creating a new instance. The other requests came from simple servlets.
Use the tracer of your choice starting with Payara Platform 5.194.
Try it Out! Download Payara Platform 5.194

Related Posts
What to Expect From Jakarta Concurrency 3.1 With Jakarta EE 11?
Published on 03 Sep 2024
by Luqman Saeed
0 Comments

The upcoming release of Jakarta EE 11 is expected to feature a number of updated specifications. One of the key updates expected in this release is to Jakarta Concurrency, which will be advancing to version 3.1. This update is set to bring a ...
The Payara Monthly Catch - August 2024
Published on 29 Aug 2024
by Chiara Civardi
0 Comments

Summer didn't stop our experts at Payara from producing meaningful content to help software developers and DevOps specialists power up their Jakarta EE applications. As August ends, we curated the top highlights from the month for you to check ...