Search Results for “monitoring console”
Displaying 51 – 60 of 321 results
-

Creating a Service for Payara Server - Video Blog Series Watch our series of four short how-to videos. See how to create a Payara service and asadmin command, and how to add configuration data and a service to the admin console.... Watch our series of four short how-to videos. See how to create a Payara service and asadmin command, and how to add configuration data and a service to the admin console. Create a Payara Service This vlog demonstrates the basics of creating a service with a walk through of the process. Create...
-

What's New in the Payara Platform May Release? Payara Enterprise 5.28.0 and Payara Community 5.2021.3 introduce a security feature, Admin Console improvement, Hazelcast integration improvement, and security and bug fixes.... The May Payara Platform release is here! With the Payara Enterprise 5.28.0 and the Payara Community 5.2021.3 releases, we're introducing an HSTS security feature, an improvement to the Admin Console performance, better integration of Hazelcast along with new functionalities provided in Hazelcast...
-

Did You Know? Payara Server and Payara Micro Come with HealthCheck Service Payara Server and Payara Micro Come with HealthCheck Service for Automatic Self-Monitoring to Detect Future Problems... Did You Know...
-

Improvements to SQL Logging in Payara Server 173 Payara Server 173 release introduces new monitoring statistics for JDBC connection pools to enhance the user experience for SQL fine tuning.... JDBC Monitoring Improvements As part of Payara Server 4.1.2.173 release, the following monitoring statistics for JDBC connection pools have been added to enhance the user experience for SQL fine tuning, in addition to the logging events mentioned earlier: FreqUsedSqlQueries A list of the top 10...
-

Nugget Friday - Mastering Jakarta REST Filter Chains Learn how to use Jakarta REST filters to add security, logging, compression, and monitoring to your REST applications. Examples and best practices included.... In today's Nugget Friday, we're tackling a powerful but often misunderstood feature of Jakarta REST (formerly JAX-RS): filters and filter chains. Whether you're handling security, logging, compression or other cross-cutting concerns, understanding filters is important for building reliable Jakarta...
-

The HealthCheck Service In-Depth - Payara Micro The Health Check Service provides automatic self-monitoring in order to detect future problems as soon as possible. See how to use it in Payara Micro... the threshold is met. We need to capture the warning messages to make them useful. The easiest way to capture them is to redirect the standard output of Payara Micro into a file. The messages could then be captured by a monitoring tool, or displayed in a log viewer: How to configure the monitoring...
-
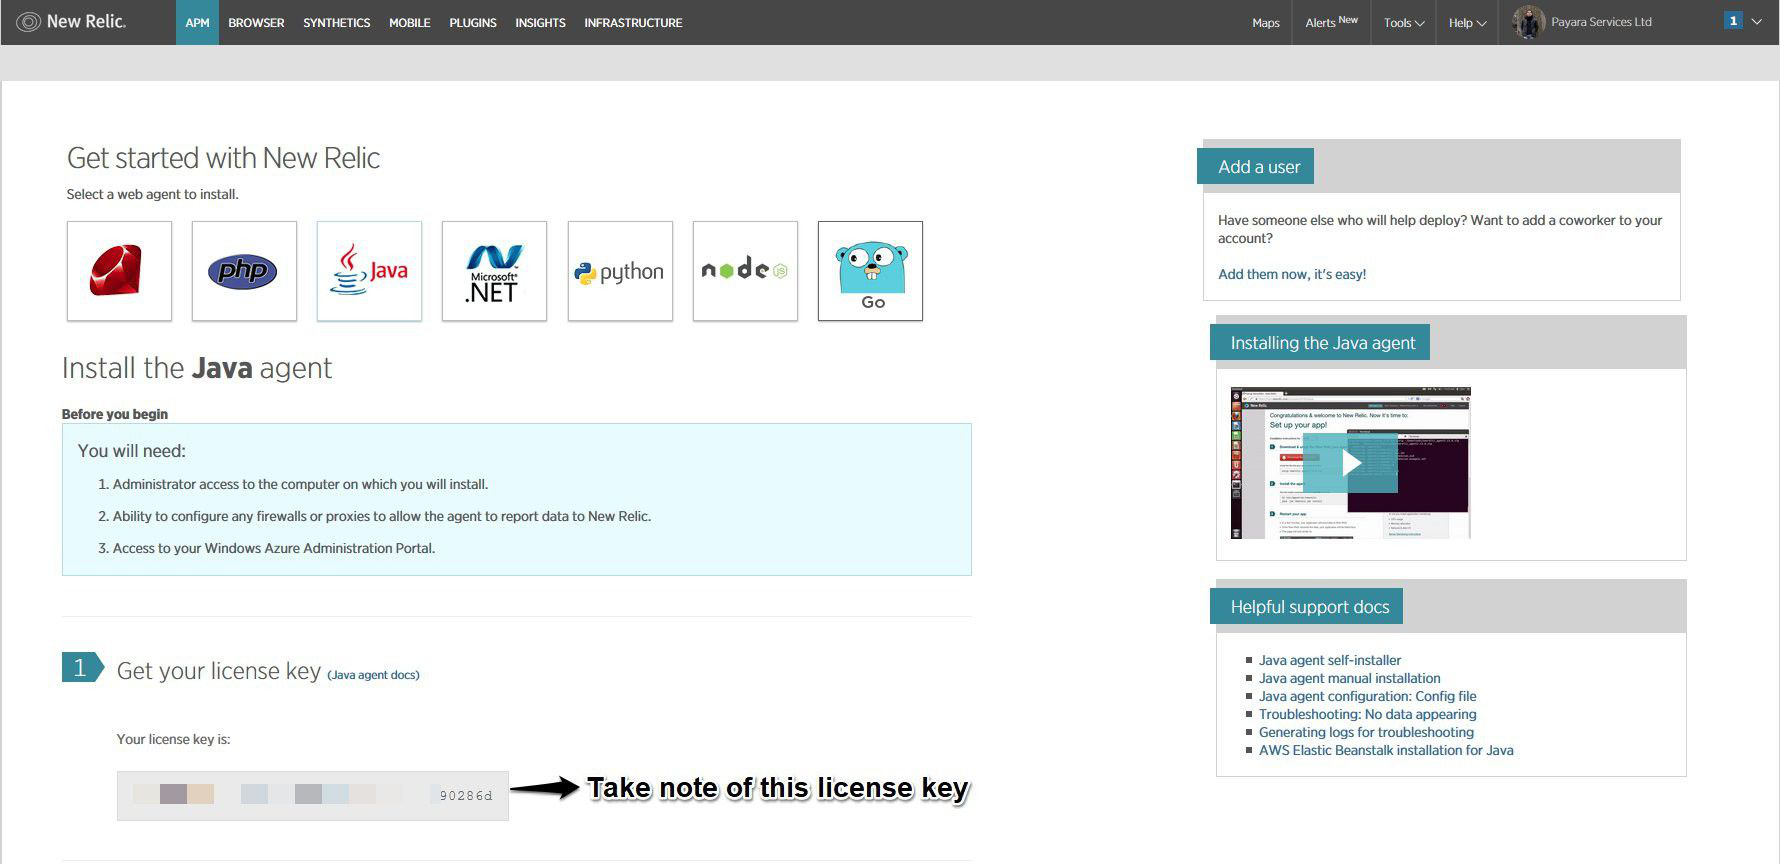
New Relic and DataDog notifiers for Payara Server As part of release 4.1.2.173, new notifier integrations were developed for Payara Server for the New Relic and DataDog application performance monitoring (APM) services.... As part of release 4.1.2.173, new notifier integrations were developed for Payara Server for the New Relic and DataDog application performance monitoring (APM) services. Both services allow the gathering of JVM statistics, HTTP metrics and support the use of notification for critical events...
-

Advanced Administration & Maintenance of Payara Server This Guide summarises some very useful maintenance features of Payara Server, such as: Backing up and restoring, Execution of admin commands in batch, Monitoring and Deployment of multiple application versions.... resources page or our getting started page. This Guide summarises some very useful maintenance features of Payara Server, such as: Backing up and restoring Execution of admin commands in batch Monitoring Deployment of multiple application versions The guide features a demo on Application Versioning...
-

What's new in Payara Server & Payara Micro 174? The Payara Server 174 release introduces over 100 bug fixes, 5 New Features & 18 Improvements including Soteria support & full MBean integration via the JMX Monitoring Service.... Our last release of 2017 - Payara Server/Micro 4.1.2.174 - is now available for download ! The final public release for this year contains over 100 bug fixes, 5 new features and 18 improvements including Soteria support, full MBean integration via the JMX Monitoring Service and wider support for environment variable substitution. Check out the full release notes, or read on for a short summary of 174's major features.
-
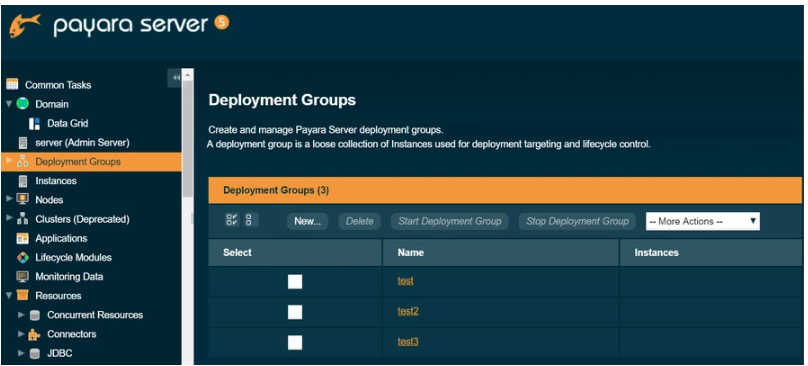
5 More Production Features of Payara Server 5 You (Probably) Don't Know About 5 production features of Payara Server 5 that you might not know about - but should: deployment groups, MicroProfile Metrics and HealthCheck, MicroProfile HealthCheck,REST Monitoring of JMX Data and The JMX Logging Service.... → select <deployment-group> → Instances tab → press New button or select existing instances from drop-down : Find out more about the Deployment groups. MicroProfile Metrics and HealthCheck Monitoring applications is a necessary part to get complete visibility into your applications and find any potential...