
Search Results for “monitoring console”
-

Building Your Next Microservice With Eclipse MicroProfile Fault Tolerance. We care about any services we consume and ensuring we can fail fast or recover from failures Monitoring. We want to know how often this service is invoked, and how long each request takes. A REST controller and service First, we have our rest controller, which should look very familiar to Java EE developers: @Path("/api/books") // just a basic JAX-RS resource... Monitoring. We want to know how often this service is invoked, and how long each request takes.
-

New Feature in Payara Server & Payara Micro 5.182: MicroProfile OpenTracing using MP OpenTracing requires you to enable the Request Tracing Service (disabled by default), it also means you can quickly turn it off by disabling the service with an asadmin command (or with the Admin Console).... using MP OpenTracing requires you to enable the Request Tracing Service (disabled by default), it also means you can quickly turn it off by disabling the service with an asadmin command (or with the Admin Console).
-

Payara para Principiantes - Todo lo que necesitas saber acerca de los nodos Payara Micro instances can join a cluster automatically. They could also join the Domain Data Grid as well as standalone Payara Server instances. In this blog, I explain how to join Payara Micro instances to the Data Grid in the Admin Console.... Cuando se desarrolla una aplicación en Payara Server, es muy común desplegar directamente en la instancia local del Servidor de Administrador de Dominios (DAS), ya que esta es la forma más sencilla y directa para probar rápidamente las aplicaciones desplegadas en su desarrollo. Al llevar una...
-
Volver a lo básico - Cómo desplegar una aplicación en Payara Server / GlassFish 4.1 If you’re still managing Java applications on GlassFish middleware, you might be hitting some roadblocks , such as difficulties with automation, lack of integrated monitoring and official support and limited abilities with modern tools. However, ...... Esta es la segunda parte de nuestra serie "Payara Server - Volver a lo básico". Mira la Parte 1 - Instalando Payara Server en Ubuntu...
-

What's new in Payara Server 153 ? Not all of the changes we implement into our releases come from the Payara Team. Kenji Hasunuma ( Khasunuma ) has kindly updated the Japanese translation of the Admin Console. Phillip Ross ( phillipross ) and Nathan Longley have also had their efforts included in this release. We greatly appreciate these community translations and commits, and look forward to what the community does for us next!... The third quarter of 2015 is quickly approaching, which means it’s time for another Payara Server release ! We’ve managed to put quite a bit into this release, with large improvements for the Payara Micro API.For this release we’ve also updated the layout of our GitHub wiki a little; we’ve separated...
-

Payara Micro JCA Adapters - Apache Kafka This also means that it loses a few features associated with other message brokers. For example, there's no web frontend built in, and performance monitoring is limited to JMX. If you want a message broker to process messages extremely quickly with low resource usage, Kafka is a good fit.... sudo bin/kafka-console-producer.sh --broker-list 192.168.29.139:9092 --topic testing... sudo bin/kafka-console-consumer.sh --bootstrap-server 192.168.29.139:9092 --topic testing --from-beginning...
-

Persistent EJB Timers in Payara Micro If all went well, the REST resource should be available at http://localhost:8080/persistentTimers/timers using the POST method. Once we access it, the request will trigger a timer scheduled to fire every 10 seconds. After a while, you should be able to see messages like these in the console output:... We should see in the console output that the previously scheduled timer is being scheduled automatically:... Payara Micro is packed with most of the features and APIs that come with Payara Server Full Profile even though it doesn't entirely support whole Jakarta EE Full Profile. As an example, Payara Micro supports persistent EJB Timers, which are only required by the Jakarta EE Full Profile...
-
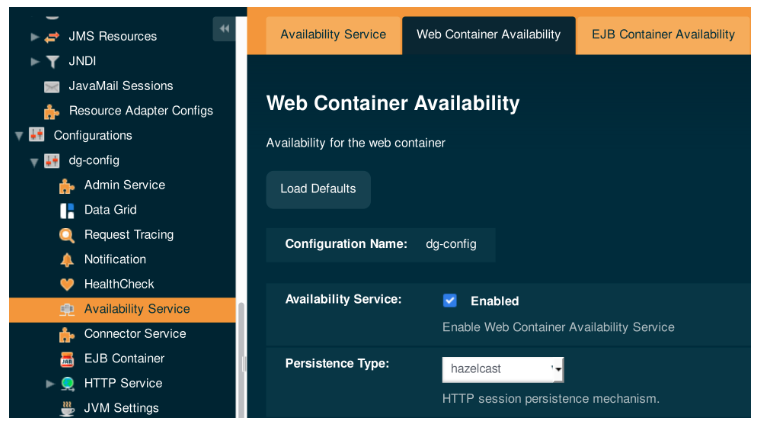
Session Replication in Payara Server with Hazelcast There are a lot of monitoring and alert mechanisms available within Payara Server . For example, it is possible to report user requests or database calls that take too long, or to report when high CPU or high memory usage occurs. But it is ...... *Note: This blog post is an update to Dynamic Clustering and Failover on Payara Server With Hazelcast, which was written for Payara Server 4...
-

We Will See You at W-JAX 2018! Microservices architecture has many benefits but it comes at a cost. Running microservices and monitoring what’s going on is tedious. That’s why MicroProfile adopts monitoring as a first class concept. In this session, learn how MicroProfile runtimes collect metrics and how to seamlessly collect... W-JAX is the leading conference for Enterprise Technology, Software Architecture, Agile and Java in Europe. We are proud to be sponsoring the "Java Enterprise Day" and will be speaking at the event as well...
-

Migrate from GlassFish to Payara Server Enterprise If you’re still managing Java applications on GlassFish middleware, you might be hitting some roadblocks , such as difficulties with automation, lack of integrated monitoring and official support and limited abilities with modern tools. However, ...... When commercial support for GlassFish ended in 2014, Payara Server was created as a fully-supported drop-in replacement. Payara Services was born in 2016 to offer support solutions for the application server. By 2017, Payara Services had joined The Eclipse Foundation and the Payara Platform expanded...