
Originally published on 13 Sep 2018
Last updated on 06 Sep 2019

This debugging guide will help you to diagnose and detect the cause of errors in your application by debugging Payara Server or Payara Micro.
Prerequisites : Payara NetBeans IDE Plugins Installation
1. Debugging the Application Deployed to Payara Server
If you want to debug your application deployed on Payara Server, you may start a server in the debug mode :
1.a) Using NetBeans IDE Plugin :
Adding Payara Server to NetBeans :
- Go to Tools → Servers.
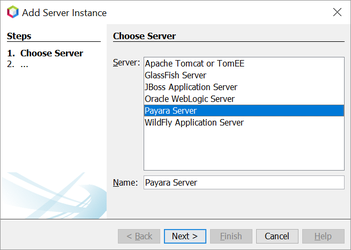
- Click Add Server.
- Select Payara Server and choose a name for the server.
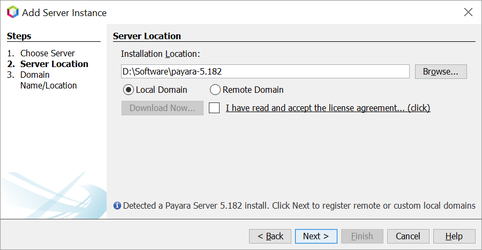
- Select the location of the Payara Server.
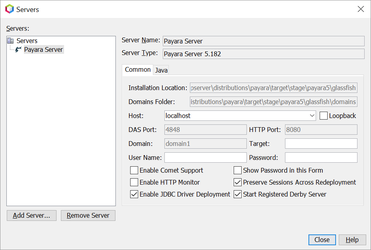
- Once Payara Server is added to NetBeans it can be found under Servers with the configured name. That’s how to add Payara Server to NetBeans.
Debugging the Application :
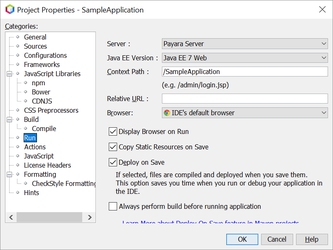
- First, the application run settings need to be configured to use Payara Server. Go to Properties on a project and then the Run section of this window. Now select the Payara Server from Server list.
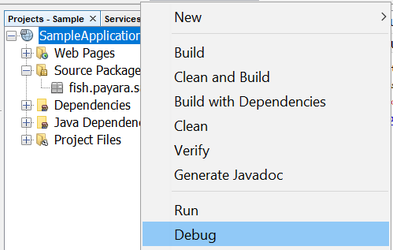
- In the Projects window, navigate to the your project, right click and In the pop-up menu select Debug. The IDE start the Payara server in debug mode and deploys the project.
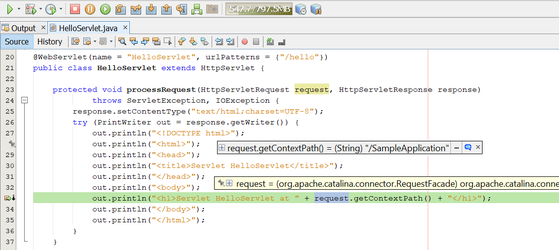
- Now add the breakpoints in the program, trace the program execution step-by-step by evaluating the value of variables and diagnosethe problem.
1.b) Using the Command Line :
- Alternatively you may also start the Payara Server in debug mode using the following asadmin command with --debug flag :
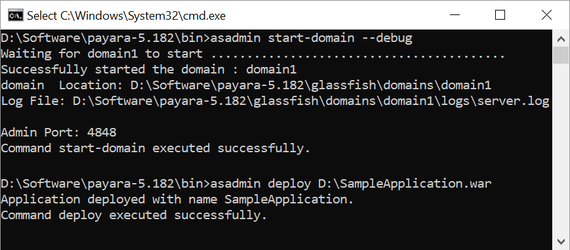
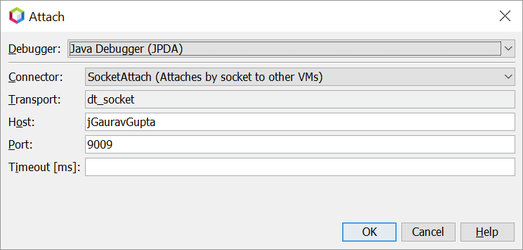
- After Payara Server starts you may manually attach the debugger to your application in the NetBeans IDE. From the main menu, select Debug → Attach Debugger, enter the port value 9009 and click ok :

2. Debugging the Payara Micro Application
If you want to debug your Payara Micro application, you may start a micro instance in the debug mode :
2.a) Using NetBeans IDE Plugin :
Creating Payara Micro Application :
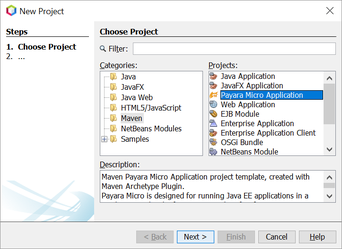
- Simply start up the NetBeans IDE and then Choose File → New Project from the main menu.
- On the Choose Project panel, select Maven from Categories, select Payara Micro Application from Projects, and click Next.
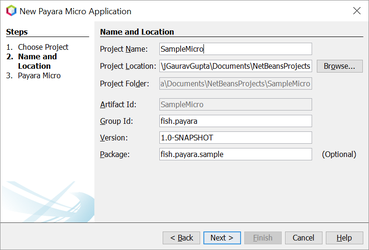
- On the Name and Location panel, enter SampleMicro as the project name, set the Project Location, set the GAV details, and then click Next.
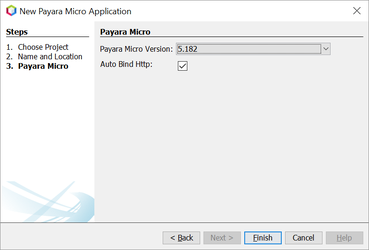
- Select Payara Micro version and click Finish.
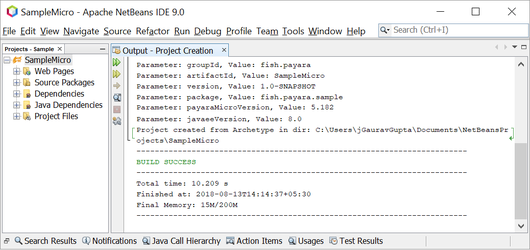
- When you click Finish, the IDE creates the project.
Debugging the Application :
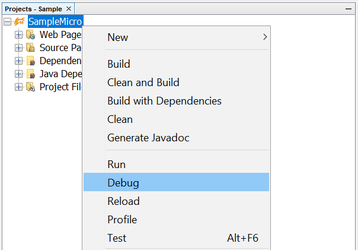
- In the Projects window, right click on the created project and select the Debug in the pop-up menu :
- Now, the IDE starts the Payara Micro instance in debug mode :

- Now add the breakpoints in the program, trace the program execution step-by-step by evaluating the value of variables and diagnosethe problem.
2.b) Using the Command line :
Creating the Payara Micro Application :
Payara Micro application can be created from command line using the following maven archetype command :
mvn archetype:generate -DarchetypeGroupId=fish.payara.maven.archetypes -DarchetypeArtifactId=payara-micro-maven-archetype -DarchetypeVersion=1.0.1 -DgroupId=fish.payara.micro -DartifactId=micro-sample -Dversion=1.0-SNAPSHOT
Maven will ask for the project detail confirmation. Press enter or press Y and Maven will start generate the Payara Micro project.
Debugging the Payara Micro Application :
Now open the pom.xml and update the configuration of fish.payara.maven.plugins:payara-micro-maven-plugin by adding javaCommandLineOptions config under configuration tag :
<javaCommandLineOptions>
<option>
<value>-Xdebug</value>
</option>
<option>
<key>-Xrunjdwp:transport</key>
<value>dt_socket,server=y,suspend=y,address=5005</value>
</option>
</javaCommandLineOptions>
Now you are ready to start Payara Micro instance in debug mode with the following command :
mvn package payara-micro:start
When payara-micro goals will start executing, you may manually attach the debugger to your application in the NetBeans IDE.
From the main menu, select Debug → Attach Debugger, enter the port value 9009 and click OK to connect :
Now, load the project in the IDE and add the breakpoints in program to analyse the program execution.
I recommend debugging via Payara Plugins
to quickly start the debugging session in one click.

Related Posts
JBoss EAP 7 End of Support: What Java Developers Need to Know (And What to Do Next)
Published on 15 Aug 2025
by Chiara Civardi
0 Comments

As a Java developer, you may not control runtime support contracts, but what you can do is help your team stay ahead of platform shifts that impact stability, compliance and portability. And here’s a big one:
📢 Red Hat officially announced ...
Running Payara Server as a Service - Added Support for systemD on Linux
Published on 19 Nov 2021
by Rudy De Busscher
3 Comments

Before your application can respond to any request from the user, Payara Server needs to be started as a process on a machine. The Payara Server Domain instance or a Payara instance can be started using the Asadmin CLI tool.
But in many cases ...