
Originally published on 22 Mar 2016
Last updated on 06 Jan 2020

Of course, as responsible developers, we all thoroughly test our code and therefore our applications never need troubleshooting; it's everyone else's code that goes wrong.
So what do we do when the inevitable happens?
 Troubleshooting your application is a huge topic, purely because of the many different ways that things can go wrong. This blog won't be on anything as subjective as debugging, then, I'll focus on what things Payara Server can do to help you troubleshoot problems.
When you’re looking into a new problem, the main key for success is always to collect as much data as possible. If you don’t have the full picture of what’s going on, then you’ll never be sure you’re looking in the right place. You need to make sure that whatever data you collect on the problem gives you an overview of the whole system too, not just the application server. If the problem you are trying to solve is outside of Payara Server, but only causes effects for the server, then you will struggle to get to the real cause.
Logging
The first place to start is often the application server logs. Logs can be most easily configured from the admin console as shown in the screenshot below:
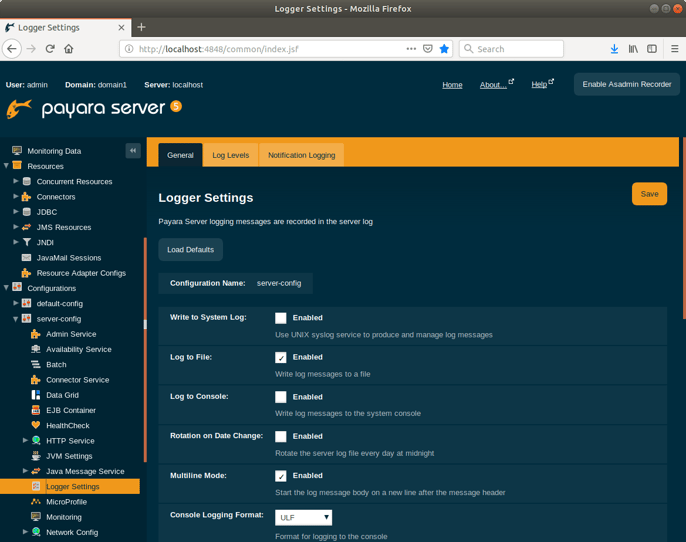
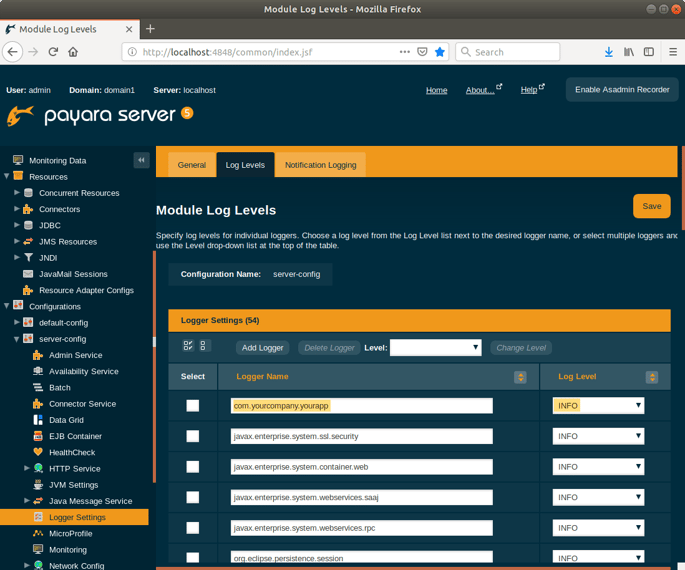
In production, it is often advisable to limit the amount of logging to WARNING level for most packages, and INFO only for those which have been determined to be important enough, or for your own application code:
Getting logging right is very important to make sure you have enough insight to be able to diagnose issues, but not too much that it might cause problems. Excessive logging can take CPU cycles away from your application, or cause issues with disk space.
It is also worth configuring your logs to rotate every day, rather than by file size. The default is for logs no bigger than 2MB, so excessive logging can cause the file to rotate too often to be useful.
Monitoring
Payara Server, like other Java Application Servers, has JMX MBeans available to use for monitoring purposes. These can be accessed with a tool like JVisualVM with the “MBeans” plugin installed:

As you can see, Payara Server is detected as a GlassFish, since it is derived from GlassFish. Since I am running VisualVM locally and as the same user as I started Payara Server with, VisualVM automatically added the running instance using jstatd. In real-world usage, you are more likely to connect to Payara Server over JMX, so I have added it using the highlighted JMX button on the toolbar.

The default port for JMX is 8686
You will find several MBean trees listed, with the Payara Server MBeans listed under amx. If you have done nothing else to configure monitoring, you will notice quickly that all the MBeans you find will tell you about the configuration of Payara Server, but not what is going on inside the server.
This is because monitoring is not enabled by default. In the admin console, select the Monitoring section for the configuration for the server or cluster you are using. Each of the available modules will be set to OFF, but can be changed to LOW or HIGH.
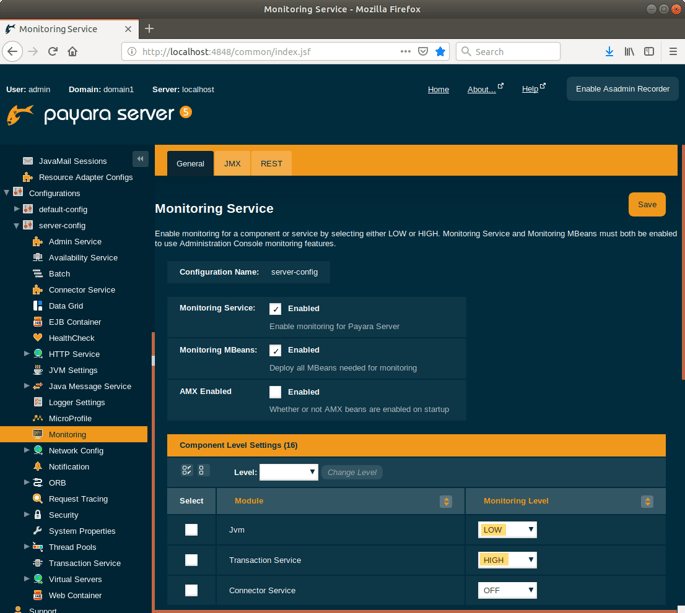
After switching all these to HIGH (and remembering to click the “Save” button) you can see some new MBeans are created with the suffix –mon:

Here I’ve opened the web-request-mon MBean for the Admin GUI and double-clicked on the value for requestcount so I can see how many requests have been served by the admin console. Note that this is any request, so every page click will result in a number of requests.
Monitoring of MBeans can be used to keep track of things like database connection pool usage or HTTP thread pools when looking for bottlenecks or other issues like high connection churn (connections being destroyed and recreated too often). JMX can be used to monitor lots of other things relating to server health, too, like CPU usage, threads, and garbage collection activity:

Payara Server Exclusive Features
So far, we’ve looked at features which are available in Payara Server which are also available in GlassFish. The 161 release of Payara Server included two new, exclusive features which should help when troubleshooting problems, both detailed in Steve’s blog.
Slow SQL Logging
The Slow SQL Logger is very easy to turn on for a given connection pool. Simply set the threshold to be an appropriate number of seconds above 0 in the Advanced tab of the connection pool:
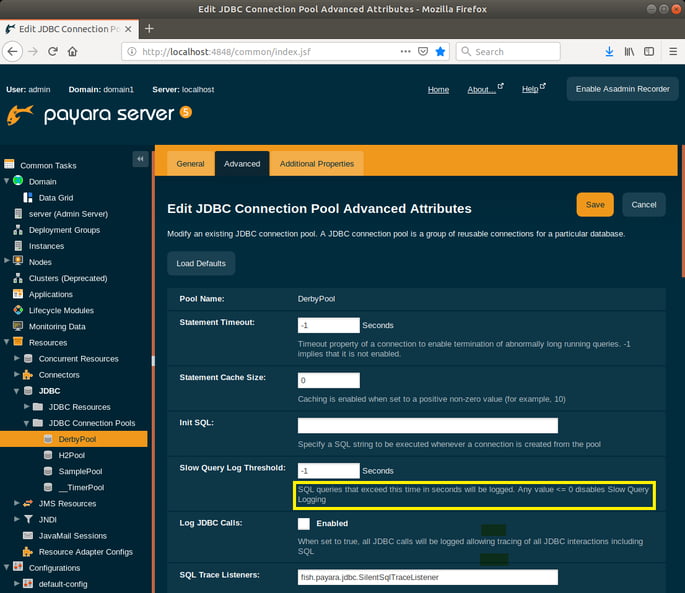
The property to set in Payara Server is fish.payara.slow-query-threshold-in-seconds and can be set in the data source configuration of a web.xml file as follows:
<data-source>
     <name>java:global/ExampleDataSource</name>
     <class-name>com.mysql.jdbc.jdbc2.optional.MysqlXADataSource</class-name>
     <server-name>localhost</server-name>
     <port-number>3306</port-number>
     <database-name>mysql</database-name>
     <user>test</user>
     <password>test</password>
     <!-- Example of how to use a Payara specific custom connection pool setting -->
     <property>
         <name>fish.payara.slow-query-threshold-in-seconds</name>
         <value>5</value>
     </property>
   </data-source>
Healthcheck Service
The Healthcheck Service has a number of different “checkers” available which, when enabled, report on various aspects of Payara Server by printing to the log file:
- CPU usage checker
- Calculates the CPU usage and prints out the percentage along with the usage time
- Configurable thresholds
- Garbage collector checker
- Calculates and prints out how many times GC is executed with its elapsed time.
- Calculates and prints out how many times GC is executed with its elapsed time.
- Machine memory usage checker
- Calculates the machine memory usage and prints out the percentage along with the total and used physical memory size.
- Configurable thresholds
- Heap memory usage checker
- Calculates the heap memory usage and prints out the percentage along with initial and committed heap sizes.
- Configurable thresholds
- Hogging threads checker
- Identifies any stuck threads
For those checkers which have configurable thresholds, those can be set as follows:
<cpu-usage-checker enabled="true" unit="SECONDS" name="CPU" time="3">
    <property name="threshold-critical" value="90"></property>
    <property name="threshold-warning" value="70"></property>
    <property name="threshold-good" value="0"></property>
</cpu-usage-checker>
The resulting configuration may end up looking something like this:
<health-check-service-configuration enabled="true">
    <cpu-usage-checker unit="SECONDS" name="CPU" time="5" enabled="true"></cpu-usage-checker>
    <garbage-collector-checker unit="SECONDS" name="GC" time="5" enabled="true"></garbage-collector-checker>
    <machine-memory-usage-checker enabled="true" unit="SECONDS" name="MMEM" time="5">
        <property name="threshold-critical" value="90"></property>
        <property name="threshold-warning" value="70"></property>
        <property name="threshold-good" value="0"></property>
    </machine-memory-usage-checker>
    <heap-memory-usage-checker unit="SECONDS" name="HEAP" time="5" enabled="true"></heap-memory-usage-checker>
</health-check-service-configuration>
In the above configuration, the CPU, garbage collector and heap memory checkers are enabled to print out every 5 seconds. The machine memory checker is additionally configured with example threshold values.
Ultimately, the action you take when troubleshooting applications comes down to what sort of problem you’re experiencing. There are many other generic Java tools like Java Mission Control which can be used to get to the bottom of the issues you’re having, which are always worth researching.
Related Posts
JBoss EAP 7 End of Support: What Java Developers Need to Know (And What to Do Next)
Published on 15 Aug 2025
by Chiara Civardi
0 Comments

As a Java developer, you may not control runtime support contracts, but what you can do is help your team stay ahead of platform shifts that impact stability, compliance and portability. And here’s a big one:
📢 Red Hat officially announced ...
The Payara Monthly Catch - July 2025
Published on 31 Jul 2025
by Chiara Civardi
0 Comments

Your Round-Up of the Latest Java & Jakarta EE News.
Welcome aboard the July issue of The Monthly Catch. As always, we’re bringing you the latest updates, product news and expert resources from across the Payara ecosystem.
This month, we’re ...