
Originally published on 05 Jun 2015
Last updated on 09 Oct 2019

 Elastic Middleware describes middleware capable of expanding and contracting quickly on demand. A common example is the ability for an application server cluster to quickly expand the number of cluster nodes to meet an unpredicted surge in the level of traffic.
The whole philosophy of Payara Micro is to turn the idea of application servers on its head and change the perception that they are large, complex and unwieldy environments for building server side applications. So as part of our development we've done some analysis of how small the core runtime of Payara Micro is.
If you are familiar with the Eclipse Memory Analyzer Toolkit ; a fantastic tool that every Java developer should be aware of; you'll know that it essentially analyzes JVM heap dumps to rapidly tell you which objects are holding the most memory in your JVM. As part of our Payara Micro tuning we recently ran MAT across a “raw” Payara Micro instance i.e. a server with clustering enabled but no applications deployed to determine the heap used and to look for tuning opportunities. So to get the data we fired up Payara Micro; We then fired up jvisualvm and hit the “Heap Dump” button on the “Monitor” tab
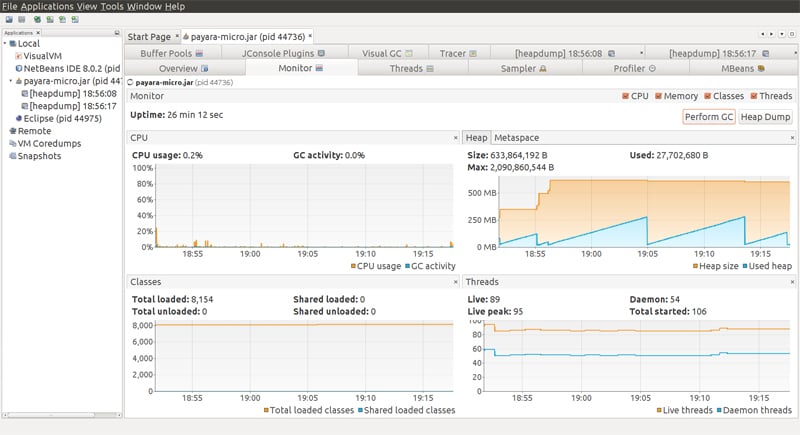
Opened up the heap dump in MAT and here's the results;
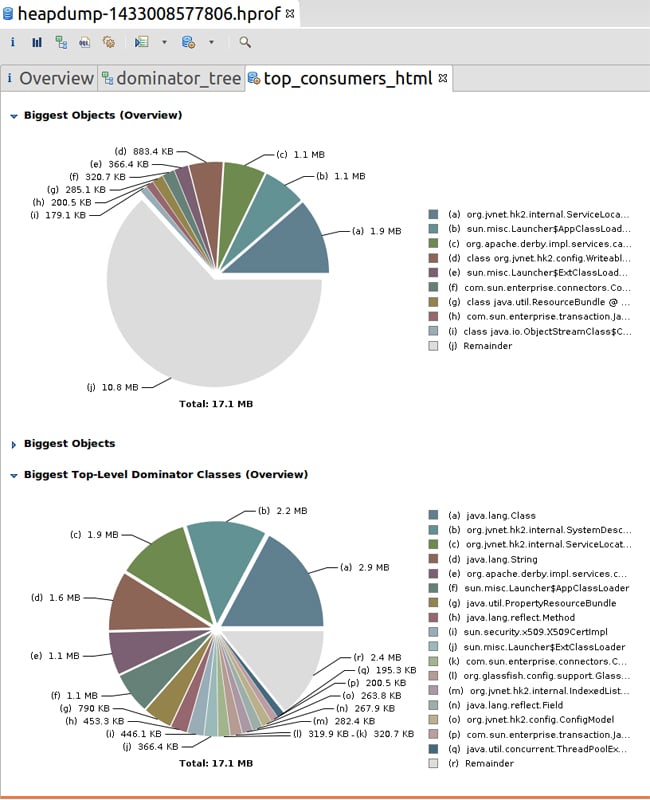
As you can see Payara Micro only uses 17Mb of JVM Heap when running raw. Now that is micro!Why does that matter? Well a smaller core runtime leaves more memory available for your applications to use. It means less garbage collections for better performance. It means higher densities of deployments on cloud environments.It also means if you use the built in JSR 107 Caching capabilities you can store more data in memory across your Payara Micro Grid.
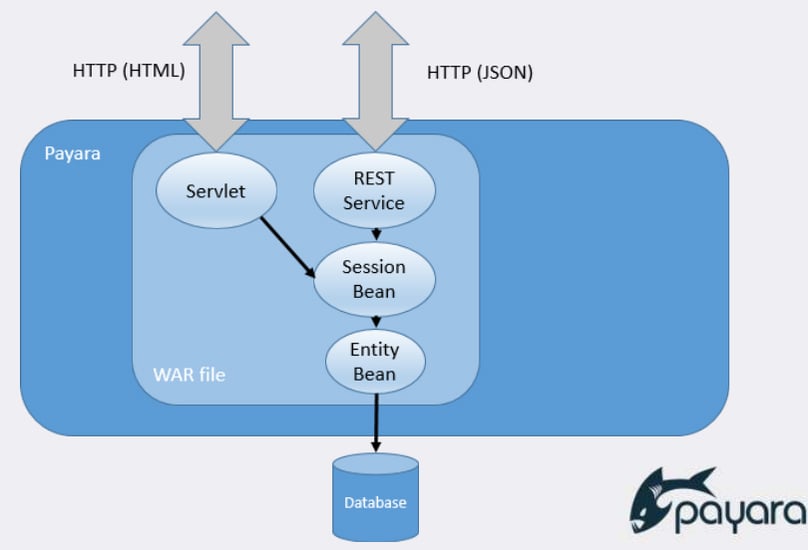
Now you may be thinking that's all well and good but what about when running an application. So we also analysed the heap usage after we'd deployed a recent demonstration application we created for NetBeans day.The demo application isn't complicated but consists of an entity bean, session bean, JAX-RS service; embedded Derby and a servlet and the NetBeans RESTful service test application so it does initialize and use most of the runtime components and containers people use. The war was approximately 300Kb in size.
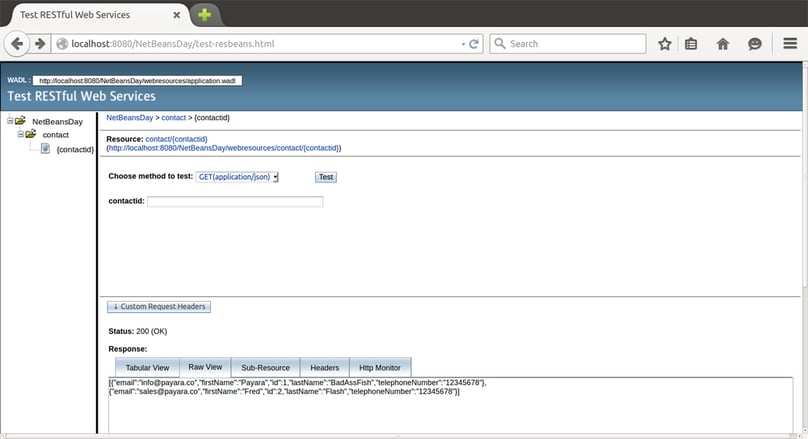
If you've never seen the NetBeans Test app for RESTful web services it's shown below for this application.
So here's the updated MAT results;
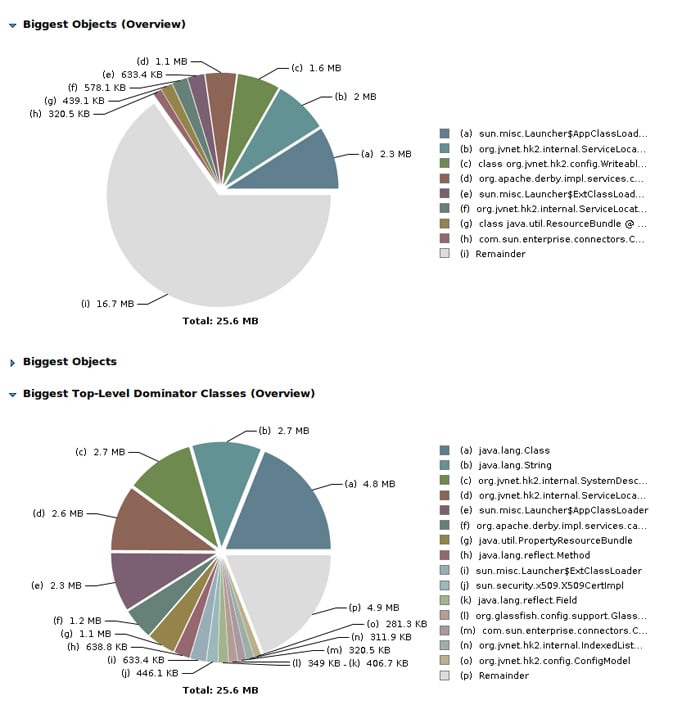
25.6MB of heap used. We think this is pretty good. We hope you do to! We'd love you try out your applications and let us know the results.
Related Posts
The Payara Monthly Catch - August 2025
Published on 02 Sep 2025
by Dominika Tasarz
0 Comments

Welcome aboard the August 2025 issue of The Payara Monthly Catch! With summer in full swing, things may have felt a little more quiet across the Java world - but certainly not less interesting! We hope you managed to get some rest and recharge, ...
Conquering Kubernetes Complexity: Why Java Developers Need More Than Just Containers
Published on 08 Aug 2025
by Chiara Civardi
0 Comments

Kubernetes, also known as K8s has become the de facto platform for orchestrating modern microservices architectures, promising resilience, scalability and faster deployment pipelines for Java applications. But for many developers, that promise ...