
Originally published on 22 Mar 2024
Last updated on 22 Mar 2024

Slow SQL queries can silently undermine your application's efficiency and the overall user experience. These sluggish queries not only frustrate users with long load times, but they can also have significant costs:
- Reduced Productivity: Waiting for slow queries can impact efficiency and lower overall productivity within your business.
- Increased Infrastructure Expenses: A quick fix to compensate for poor database performance is scaling hardware prematurely, which can unnecessarily increase infrastructure costs.
- Lost Opportunities: Slow response times directly impact user experience, potentially leading to abandoned transactions and lost revenue.
Detecting and Analyzing Slow Queries
Payara Server offers the slow SQL logger feature that can help pinpoint the root cause of slow database interactions. The feature works by:
- Monitoring: The Slow SQL Logger keeps track of all SQL queries executed through your JDBC connection pool.
- Thresholding: You define a time threshold, in seconds or milliseconds. When a query exceeds this limit, it gets logged.
- Providing Detailed Warnings: The logger generates a warning message in the server log that contains:
- The SQL query itself.
- The execution time.
- A stack trace pinpointing to the exact lines of code where the slow query originated.
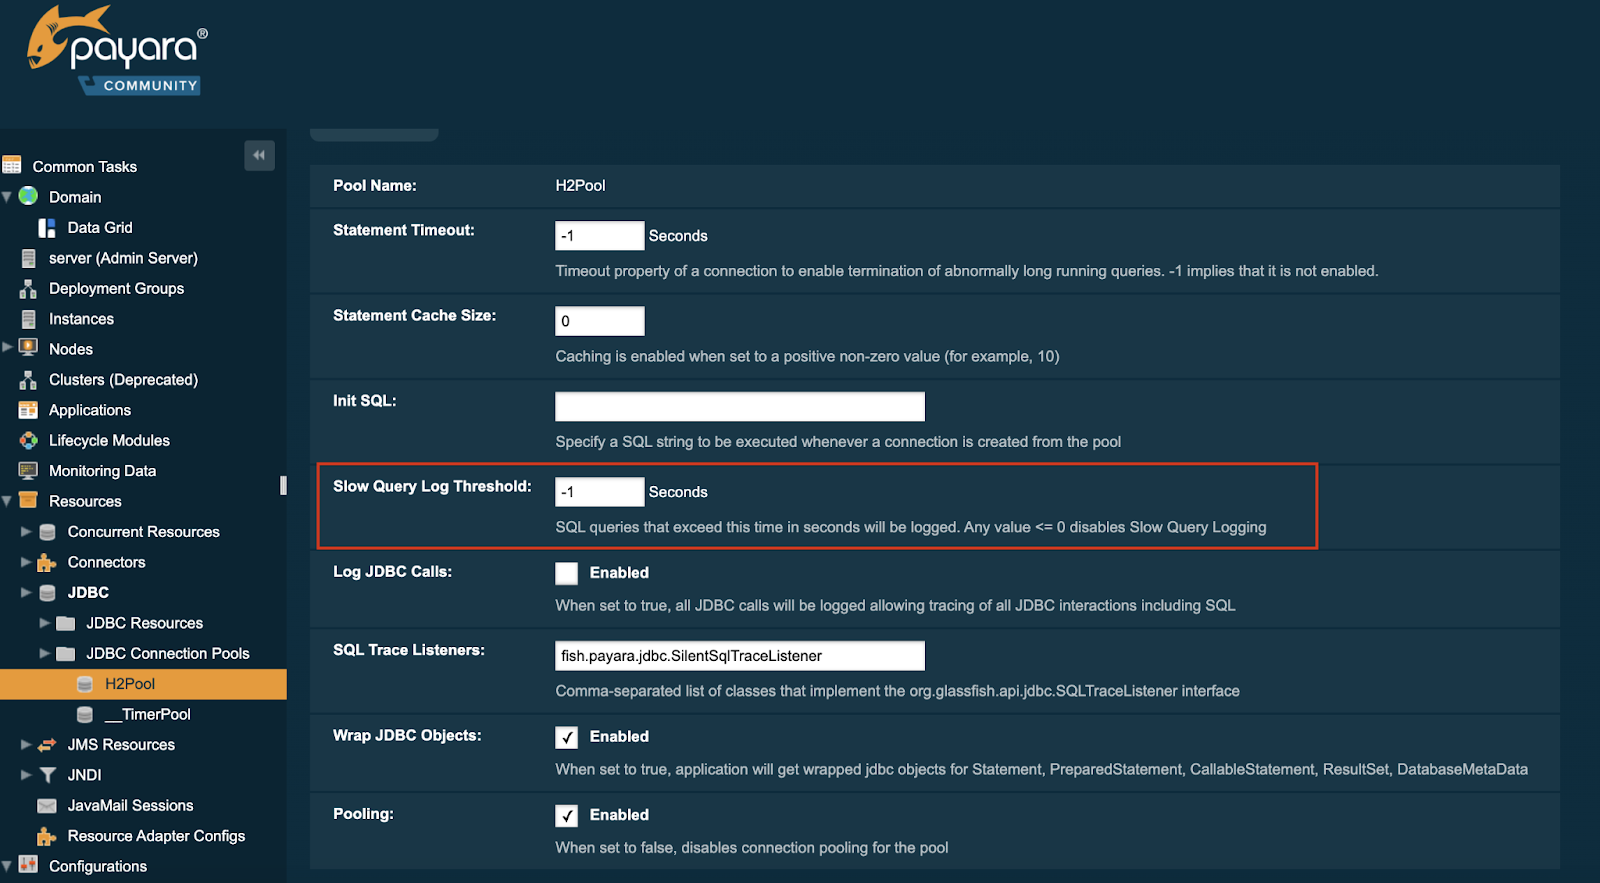
Setting Up The Slow SQL Logger
You can configure the slow SQL logger on Payara Server through the following options:
- Administration Console: Navigate to your JDBC connection pool's "Advanced Properties" tab and set your desired 'Slow Query Log Threshold' time.
- Asadmin Commands: Use the set command to modify the slow-query-threshold-in-seconds property of your connection pool
asadmin set domain.resources.jdbc-connection-pool.__TimerPool.slow-query-threshold-in-seconds=50
- Application Deployment: If you use Jakarta EE, you can embed configuration directly within your application code using the @DataSourceDefinition annotation.
@DataSourceDefinition(

    name = "java:app/MyApp/MyDS",

    className = "org.h2.jdbcx.JdbcDataSource",

    url = "jdbc:h2:mem:test",

    properties = {"fish.payara.slow-query-threshold-in-seconds=5"})

Proactive Problem Solving
With the Payara Server slow SQL logger, you can analyze those slow queries and target the underlying causes:
- Database Optimization: Are your tables properly indexed? Would query restructuring improve performance?
- Application Logic: Could you reduce the number of unnecessary queries or implement caching mechanisms within your code?
Payara Micro
Payara Micro also supports the slow SQL logger feature. This allows you to have in-depth insights into your cloud applications and potentially reduce cost by proactively identifying slow database queries that take up precious CPU cycle times. You can activate the slow SQL logger on Payara Micro through the @DataSourceDefinition as shown above. Otherwise, you can do so through the web.xml deployment descriptor.
Don't Let Slow SQL Queries Undermine You
By proactively detecting and analyzing slow SQL queries with Payara Server, you can safeguard your application's performance, save on infrastructure costs, and create a smoother, more satisfying user experience. Download Payara Server Community or Payara Micro Community to get started.

Related Posts
Boost Developer Productivity with Payara Server Maven Plugin + AI Agent
Published on 12 Sep 2025
by Gaurav Gupta
0 Comments

Managing Payara Server Just Got Smarter
Imagine managing your Jakarta EE applications not just with Maven goals, but by asking natural questions.
With the experimental AI Agent built into the Payara Server Community's Maven Plugin, you can ...
The Payara Monthly Catch - August 2025
Published on 02 Sep 2025
by Dominika Tasarz
0 Comments

Welcome aboard the August 2025 issue of The Payara Monthly Catch! With summer in full swing, things may have felt a little more quiet across the Java world - but certainly not less interesting! We hope you managed to get some rest and recharge, ...