Search Results for “monitoring console”
Displaying 281 – 290 of 320 results
-
Addressing the Application Server Needs of the Logistics Sector - Here's What Industry Experts Say Platform Enterprise’s ability to integrate with monitoring tools like Prometheus allows companies to gain deep insights into their application performance, enabling proactive management and optimization.... Discover how logistics companies are transforming their operations with robust application servers. Explore key trends, real-world examples as well as why DPD and Hermes chose Payara Platform in our latest blog...
-

Secure Application Server Migration Insights tolerance. Modern platforms and architectures can offer tools and features that make applications more robust. These include improved load balancing, automated failover mechanisms and better integration with monitoring tools that can detect and respond to issues more effectively. Ultimately, migrating... Automated failover mechanisms and better integration with monitoring tools that can detect and respond to issues more effectively. Ultimately, migrating means modernizing and investing in future-proof applications.... Discover insights into secure application server migrations for enterprise Java applications. Learn how expert planning can address compliance, cybersecurity concerns and enhance resilience...
-

Using Flight Recorder with Payara Server 5 There are a lot of monitoring and alert mechanisms available within Payara Server. For example, it is possible to report user requests or database calls that take too long, or to report when high CPU or high memory usage occurs. But it is sometimes not easy to identify 'why' a request takes such a long time.... There are a lot of monitoring and alert mechanisms available within Payara Server . For example, it is possible to report user requests or database calls that take too long, or to report when high CPU or high memory usage occurs. But it is sometimes not easy to identify 'why' a request takes such a long time.
-

Nugget Friday - Building Resilient Microservices with MicroProfile Fault Tolerance Allowing for environment-specific tuning without code changes. Metrics Integration: When used with MicroProfile Metrics, you get automatic monitoring of your fault tolerance mechanisms, helping you understand system behaviour. Advanced Features of MicroProfile Fault Tolerance Combining Annotations The real... Metrics Integration: When used with MicroProfile Metrics, you get automatic monitoring of your fault tolerance mechanisms, helping you understand system behaviour.... How to create resilient, fault tolerant microservices with MicroProfile Fault Tolerance in Jakarta EE...
-

How to Use Eclipse Transformer to Convert a 3rd Party Library to the New Jakarta Namespace If you’re still managing Java applications on GlassFish middleware, you might be hitting some roadblocks , such as difficulties with automation, lack of integrated monitoring and official support and limited abilities with modern tools. However, ...... Heres how to use the Eclipse Transformer project to convert a 3rd party library to the new Jakarta namespace and update your frameworks and libraries... The release of Jakarta EE 9 breaks a tradition of Java Enterprise. A legal requirement of the Java EE code donation from Oracle to the Eclipse Foundation is the change of the namespace of javax to jakarta...
-

The Payara Monthly Catch: February 2021 It may seem there are 3 ways to do the same thing in Hibernate . Thorben discusses pros and cons for each method. Inside Java podcast "#JDK Flight Recorder” with Markus Gronlund and Chad Arimura - This useful episode describes how continuous monitoring of high quantities of information through JDK... Inside Java podcast "#JDK Flight Recorder” with Markus Gronlund and Chad Arimura - This useful episode describes how continuous monitoring of high quantities of information through JDK Flight Recorder helps diagnose problems in production systems.... Our monthly Java, Jakarta EE and MicroProfile news round up of interesting articles, videos, podcasts and community news...
-

The Payara Monthly Catch: March 2021 Monitoring Deserialization to Improve Application Security - Chris Hegarty introduces the new Deserialization Event in JDK 17, and describes how it can be enabled and leveraged.... Monitoring Deserialization to Improve Application Security - Chris Hegarty introduces the new Deserialization Event in JDK 17, and describes how it can be enabled and leveraged.... Our monthly Java, Jakarta EE and MicroProfile news round up of interesting articles, videos, podcasts and community news...
-

Microservices for Java EE Developers Eclipse MP Metrics 1.1 : Provides a unified way for microservices and applications to export and generate real-time monitoring data. The default format generated by this API is based on the Prometheus ’ server data syntax.... Eclipse MP Metrics 1.1: Provides a unified way for microservices and applications to export and generate real-time monitoring data. The default format generated by this API is based on the Prometheus’ server data syntax.... See how microservices can be a valid option for Java EE developers and how Payara Micro can help them by providing a perfect platform...
-
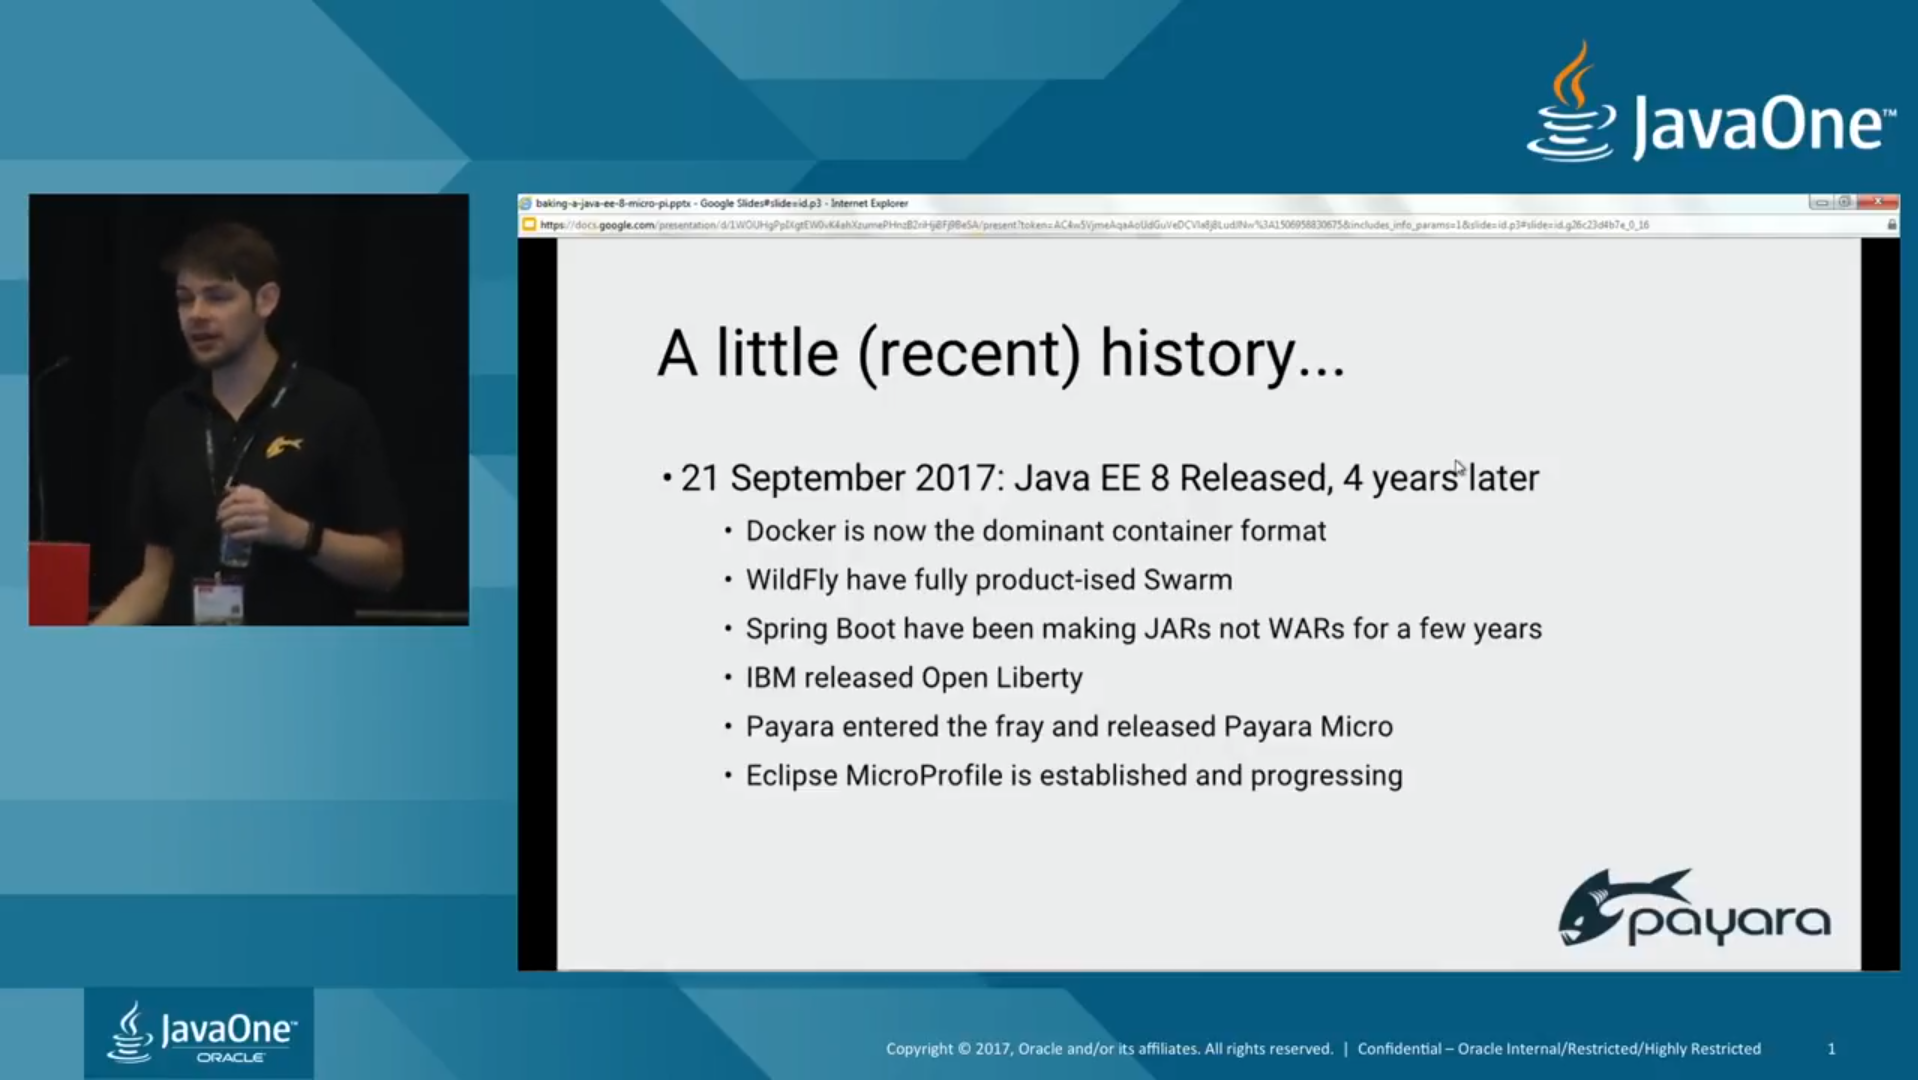
Taking Payara To The Cloud is the default product for monitoring with Kubernetes, this makes both Payara Server and Payara Micro ready for use in a modern container-orchestrated environment like Kubernetes.... product for monitoring with Kubernetes, this makes both Payara Server and Payara Micro ready for use in a modern container-orchestrated environment like Kubernetes.... Payara Server and Payara Micro have both been developed and adapted for cloud environments for a while now and the list of features available to make life easier is growing longer with each release...
-

Building Your Next Microservice With Eclipse MicroProfile Fault Tolerance. We care about any services we consume and ensuring we can fail fast or recover from failures Monitoring. We want to know how often this service is invoked, and how long each request takes. A REST controller and service First, we have our rest controller, which should look very familiar to Java EE developers: @Path("/api/books") // just a basic JAX-RS resource... Monitoring. We want to know how often this service is invoked, and how long each request takes.... This quick tutorial will show you how to build your next microservice with the latest version of Eclipse MicroProfile APIs...