
Archive from August 2016
Persistent EJB Timers in Payara Micro
Published on 31 Aug 2016
by Ondro Mihályi
Topics:
What's New,
Production Features,
Payara Micro,
Microservices,
Hazelcast,
Caching,
Clustering,
Scalability
|
0 Comments

Payara Micro is packed with most of the features and APIs that come with Payara Server Full Profile even though it doesn't entirely support whole Jakarta EE Full Profile. As an example, Payara Micro supports persistent EJB Timers, which are only required by the Jakarta EE Full Profile and not by the Web Profile. In Payara Micro, it's possible to use persistent EJB Timers, which are stored across your micro instances inside the distributed data grid as long as at least one instance in the data grid is up and running.
Making Use of Payara Server's Monitoring Service - Part 3: Using Kibana to Visualise the Data
Published on 25 Aug 2016
by Fraser Savage
Topics:
What's New,
Payara Server Basics,
How-to
|
0 Comments

When Payara Server has been logging monitoring data to the server log for a short while, the metrics that Logstash outputs to Elasticsearch can be visualised using Kibana. In this blog post, we will create a date histogram displaying used heap memory as a percentage of the maximum heap memory.


Making Use of Payara Server's Monitoring Service - Part 2: Integrating with Logstash and Elasticsearch
Published on 24 Aug 2016
by Fraser Savage
Topics:
What's New,
Payara Server Basics,
How-to
|
1 Comment

Following the first part of this series of blog posts, you should now have a Payara Server installation which monitors the HeapMemoryUsage MBean and logs the used, max, init and committed values to the server.log file. As mentioned in the introduction of the previous post, the Monitoring Service logs metrics in a way which allows for fairly hassle-free integration with tools such as Logstash and fluentd.
Often, you might find it useful to store your monitoring data in a search engine such as Elasticsearch or a time series database such as InfluxDB. One way of getting the monitoring data from your server.log into one of these datastores is to use Logstash.
This blog post covers how to get monitoring data from your server.log file and store it in Elasticsearch using Logstash.
Making Use of Payara Server's Monitoring Service - Part 1: Setting up the Service
Published on 23 Aug 2016
by Fraser Savage
Topics:
What's New,
Payara Server Basics,
How-to
|
3 Comments

(note: there is an updated version of this blog post available here https://blog.payara.fish/making-use-of-payara-servers-jmx-monitoring-service-part-1-setting-up-the-service)
With the release of version 4.1.1.163, Payara Server includes a JMX Monitoring Service (technical preview) which can be used to log information from MBeans to the server log. Using the Monitoring Service, you can monitor information about the JVM runtime such as heap memory usage and threading, as well as more detailed information about the running Payara Server instance. The information is logged as a series of key-value pairs prefixed with the string PAYARA-MONITORING:, making it easy to filter the output using tools such as Logstash or fluentd.
In this blog series we're going to show you exactly how to use the new Payara Server Monitoring Service. First, we'll take a look at setting up the service - let's get started!
What's new in Payara Server 163?
Published on 16 Aug 2016
by Mike Croft
Topics:
What's New,
Payara Micro,
Hazelcast,
CDI,
REST
|
6 Comments

As we enter the third quarter of the year, that can only mean one thing: Payara Server 163 is here! With this release, we’ve managed to cram in 44 bug fixes, 34 enhancements, 6 new features and 6 component upgrades. One of these new features is the tech preview of our new Request Tracing service, which I’ll explain in more detail below.
Payara Server Lite Nodes
Published on 09 Aug 2016
by Fabio Turizo
Topics:
What's New,
Payara Micro,
Microservices,
Hazelcast,
Caching,
Clustering,
Scalability
|
0 Comments
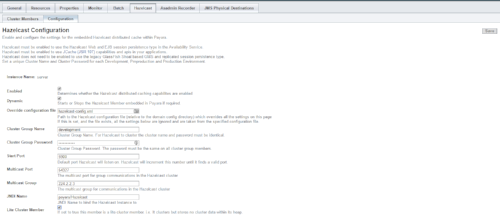
As part of the new features introduced with the release of Payara Server 162, you can now form a cluster of Payara Server instances using the concept of Hazelcast “Lite Nodes”. This can help you create more flexible cluster topologies.
Steve Millidge for Java Magazine - Custom Servlet Authentication Using JASPIC
Published on 05 Aug 2016
by Steve Millidge
Topics:
JMS,
Java EE,
GlassFish,
JVM,
JASPIC
|
1 Comment

The new Java Magazine is out now, featuring a lot of useful articles about enterprise Java - not so much Java EE as a platform, but individual services that can be useful as part of a larger solution. See below for an introduction to my article on Custom Servlet Authentication Using JASPIC, also featured in the magazine.
Payara Micro - Dynamic Clustering Demo
Published on 02 Aug 2016
by Mike Croft
Topics:
Payara Micro,
Microservices,
Demo,
Hazelcast,
Clustering,
How-to,
Scalability
|
0 Comments

Take a look at this quick demo to see some of Payara Micro's dynamic clustering capabilities. I'm running the demo without any extra tools, just Payara Micro itself. To show how Payara Micro dynamically rebalances the cluster, I used JCache and Payara Micro's --autoBindHttp feature.