
Published on 12 Sep 2016

Have you ever wondered whether your application is slow to respond to requests? Which requests take the longest to respond to? And what you can do about it? Payara Server aims to provide the best tooling you would need to identify performance issues, identify their causes and help you solve them. One part of this tooling is the new Request Tracing service, available in Payara Server and Payara Micro from version 163 as a technical preview.

Quite often, detailed logging and even monitoring statistics provided by the application server or JVM are not enough to rapidly identify and determine the cause of all the performance issues which you may be facing. For example, it is not particularly easy to identify long-running requests just from log records. If you are experiencing performance issues, their very nature means you want to know about them as quickly as possible. There might be critical issues caused by network failures or by other systems; by a slow database for example. Even in other cases, finding performance degradation early helps you plan future improvements better.
Once you find out about a performance issue, we at Payara know that it is often a struggle to analyze the available information and identify the cause so that you can fix it. The data from multiple parallel requests usually interleaves, making it hard to understand what's going on during a single request. What if you were able to collect information about each request separately? Wouldn't the job be much easier?
The new Request Tracing service helps track and log information about separate requests. It is designed to be as lightweight as possible so that it does not impose a significant processing overhead. Just by specifying a time threshold, it makes it easy to identify all long running requests. It collects various events throughout the processing of a request, such as EJB and CDI bean invocations. A collection of other events, like SQL invocation, is planned for later releases. Once a request takes longer than the specified threshold, it logs all the collected data together, in a single structured message per request. In combination with the Notification service - another new addition in Payara Server 163 - it will be able to send the collected data directly to external analytical systems in the future. Once that is done, it would be easy to visualize the request processing as shown in the following picture:
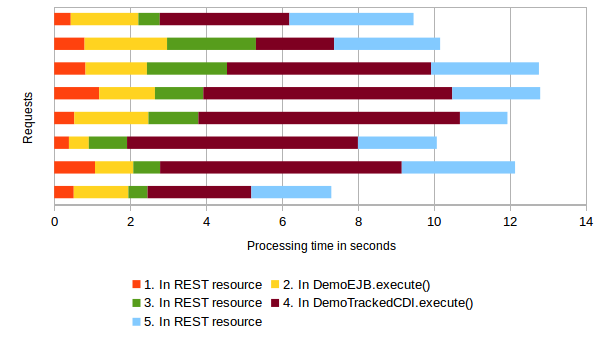
From the above example, it is immediately visible that most of the time was spent in the step no. 4 - DemoTrackedCDI.execute().
The future looks promising, but it will take some more time until it is possible to setup convenient analytics easily with Payara Server. Until then, the Payara team have released the current solution of Request Tracing service as a technical preview, because it might already be useful in non-production environments, especially for performance tests.
Let's take a quick look at how it works and how to configure it.
What information can we get with Request Tracing?
The Request Tracing service essentially intercepts all sorts of requests being processed by the server. Tracing of a request starts upon receiving a request. The service then continues with observing and collecting various events during processing and finishes when the processing of the request is finished, usually after a response is ready to be sent back. At this time, if the request took longer than the configured threshold, all the collected data is dispatched to the Notification service. From there, it is dispatched to a notifier. Currently, the only available notifier is service-log, which logs the collected data into server.log.
In Payara Server 163, the following types of requests will be traced when the service is enabled:
- REST
- Servlet
- WS
- WebSocket
- EJB timers
Others, like message-driven beans and asynchronous requests, are planned for the next version.
Once a request is being traced, the Request Tracing service collects events during processing, so that it may later provide a report of what was happening and how long it took if the configured threshold is exceeded. The following events are observed and reported:
- start/end of the request
- an EJB method entered/exited
- a CDI bean method entered/exited
More events, like SQL statement invocation, are planned to be collected in future versions.
For example, the Request Tracing service intercepts all EJB method invocations and collects information including:
- the time when the method was entered/exited (the timestamp and also the time elapsed since the request started)
- name and type of the EJB component
- name of the method
- authenticated user's name
The Request Tracing service also collects similar information when a method of a CDI bean is executed and exited. It does not do it for all CDI beans, though, as there might be just too many CDI beans invoked during a request. Only beans annotated with the @Traced qualifier are intercepted. The @Traced qualifier marks a CDI interceptor binding and can be added to a bean's class to intercept all methods, or just to particular methods. @Traced annotation is provided by both Payara Server and Payara Micro. If you want to use it, it is recommended to add the payara-micro artifact as a provided dependency in both cases, even when the application is to be deployed to Payara Server. A separate API artifact will be available, once the Request Tracing service is complete and available for production.
How to configure Request Tracing
It is very easy to turn on and configure the Request Tracing service itself, either using asadmin commands or the admin console. However, there are more pieces to configure in order to get notifications from it. The Request Tracing service has to be paired with the Notification Service, which then redirects all the notifications into a chosen notifier. The notifier then either dumps the messages into server.log, or may do something much more sophisticated, such as sending the messages to an external analytical service.
Let's go over the steps needed to get all things up and running. We will configure the Request Tracing service to identify all requests running for longer than 5 seconds and then dump the information about them into the server.log - one record for every separate request.
Configure the Request Tracing service
Using the asadmin utility, we will run a single command to turn on Request Tracing and configure a 5 second threshold at once:
asadmin> requesttracing-configure --enabled=true --thresholdValue=5 --thresholdUnit=SECONDS --dynamic=true
asadmin> requesttracing-configure-notifier --notifierName=service-log --notifierEnabled=true --dynamic=true
asadmin> get-requesttracing-configuration
Enabled  ThresholdUnit  ThresholdValue  Notifier Name  Notifier Enabled
true     SECONDS        5               service-log    true
Configure the Notification service
As explained above, we also need to configure the Notification service to turn on the notifier and route the messages into the log.
We need to turn on the Notification service and enable the notifier, which we specified for the Request Tracing service before. We will do both with a single asadmin command set-notification-configuration:
asadmin> set-notification-configuration --notifierEnabled=true --notifierName=service-log --notifierDynamic=true --dynamic=true --enabled=true
Here, again, the argument --notifierDynamic and --dynamic are only necessary to apply the changes without a server restart.
At this point, everything is configured to trace all incoming requests. Information is collected for all requests that take more than 5 seconds, and it is written into the log for each request separately.
Configuration Using the Admin Console
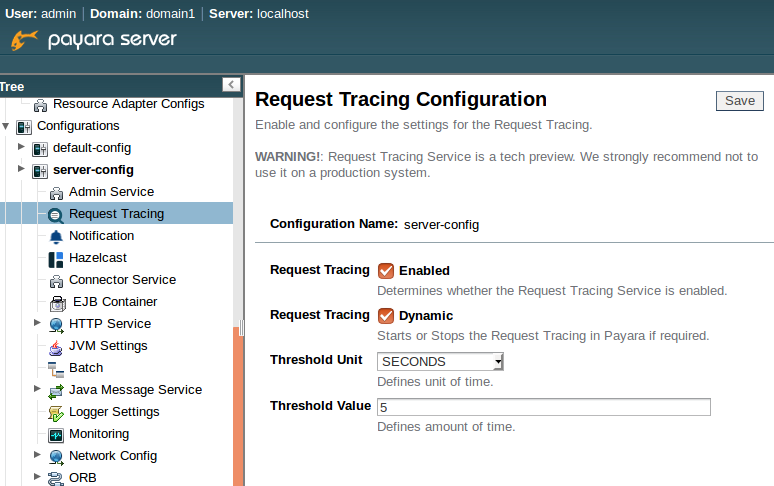
It is also possible to use the admin console to configure both the Request Tracing and Notification services. The configuration is analogous to the asadmin commands, therefore I will let the screenshots speak for me, without repeating things I have already described.
The Request Tracing section in the configuration tree is analogous to the requesttracing-configure and requesttracing-configure-notifier commands. It provides much fewer options because certain options, in the technical preview in 163, only accept a single value.
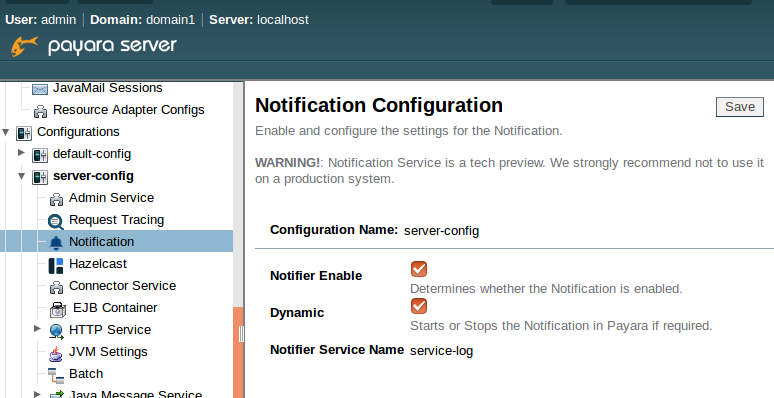
And the Notification section does the job of the set-notification-configuration command. Here, the "Notifier Service Name" is another option which currently only takes a single value, so it is not yet an editable field.
Configuration of Payara Micro
The Request Tracing and Notification services are also available for applications running on Payara Micro. Although the admin console is not available there, the same asadmin commands can be used to configure Payara Micro. However, a different approach must be taken to execute the commands, as it is not possible to execute commands remotely using the asadmin utility.

We recommend are 2 approaches available:
- configuration-based (directly changing the domain.xml)
- running the commands using the PayaraMicro API
The first option is to provide a custom domain.xml with all the required configuration. Editing the configuration file by hand might be complicated and error-prone. However, if you choose this option, we recommend to configure everything using Payara Server first as described above, and then copy the relevant parts of the configuration from the domain.xml inside the Payara Server domain.
The second option is using the API provided by Payara Micro to execute the commands from within a WAR application. This is the safer approach and does not require passing additional configuration file when running the application. The following is an example how to execute a requesttracing-configure command from within your application:
PayaraMicro.getInstance().getRuntime()
  .run("requesttracing-configure", "--enabled=true", "--thresholdValue=5", "--thresholdUnit=SECONDS", "--dynamic=true");
You should execute this code at startup, e.g. in a singleton startup EJB, and you're done. Don't forget to add the payara-micro artifact as a provided dependency to make the API available at compile time.
The data about long-running requests
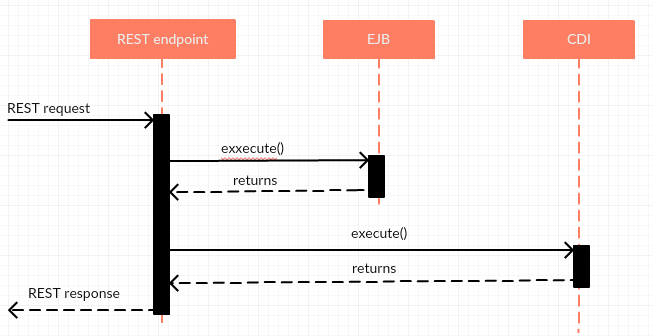
Finally, once all is configured, we just need to have one more thing to see request tracing records in the log. Obviously, we need a running application processing requests, and some requests need to take more than 5 seconds. For that purpose, I created a simple application exposing a REST endpoint, and executing an EJB and a CDI bean from the endpoint. Invocation of all three - the REST endpoint, the EJB and the CDI bean - consumes some time, as it involves non-trivial computation and accessing a slow resource (a service and a DB).
This is the sequence of execution of all the involved components during processing of a REST request:
For every request that takes longer than 5 seconds to complete, a message like the following would end up in the log:
[2016-09-01T13:02:13.456+0200] [Payara 4.1] [INFO] [] [fish.payara.nucleus.notification.service.LogNotifierService] [tid: _ThreadID=100 _ThreadName=http-thread-pool(5)] [timeMillis: 1472727733456] [levelValue: 800] [[
  Request execution time: 6286(ms) exceeded the acceptable threshold - {"RequestTrace": {"startTime":"1472727727170","elapsedTime":"6286",
"TraceEvent": {"eventType": "TRACE_START","eventName":"StartTrace","id=":"dc0d27e5-d8eb-41cc-9b7f-89a230b0dfa4","conversationId=":"dc0d27e5-d8eb-41cc-9b7f-89a230b0dfa4","timestamp=":"1472727727170","Server": "server","Domain": "domain1","traceTime=":"0"},
"TraceEvent": {"eventType": "REQUEST_EVENT","eventName":"RESTWSRequest","id=":"a85caaf3-34eb-4c99-bc8d-3aded9acac4d","conversationId=":"dc0d27e5-d8eb-41cc-9b7f-89a230b0dfa4","timestamp=":"1472727727171","accept-language": "[en-US,en;q=0.5]","cookie": "[__utma=111872281.148356872.1462355409.1471938946.1472580408.6; __utmz=111872281.1462355409.1.1.utmcsr=(direct)|utmccn=(direct)|utmcmd=(none); JSESSIONID=50143d92a74d317aaeb825691234; treeForm_tree-hi=treeForm:tree:configurations:server-config:notification; __utmc=111872281]","host": "[localhost:8080]","connection": "[keep-alive]","Method": "GET","URL": "http://localhost:8080/SimpleWAR/rest/request","accept-encoding": "[gzip, deflate]","user-agent": "[Mozilla/5.0 (X11; Ubuntu; Linux x86_64; rv:48.0) Gecko/20100101 Firefox/48.0]","accept": "[text/html,application/xhtml+xml,application/xml;q=0.9,*/*;q=0.8]","traceTime=":"1"},
"TraceEvent": {"eventType": "REQUEST_EVENT","eventName":"EJBMethod-ENTER","id=":"322fd38a-cf4e-44e6-a361-cea077c24526","conversationId=":"dc0d27e5-d8eb-41cc-9b7f-89a230b0dfa4","timestamp=":"1472727727415","EJBMethod": "execute","ComponentType": "STATELESS_SESSION_BEAN","ApplicationName": "null","ModuleName": "SimpleWAR","ComponentName": "DemoEJB","EJBClass": "demo.requesttracing.DemoEJB","TX-ID": "JavaEETransactionImpl: txId=402 nonXAResource=null jtsTx=null localTxStatus=0 syncs=[com.sun.ejb.containers.ContainerSynchronization@7a4d066a]","CallerPrincipal": "ANONYMOUS","traceTime=":"245"},
"TraceEvent": {"eventType": "REQUEST_EVENT","eventName":"EJBMethod-EXIT","id=":"68f391db-493d-4d01-bcd8-20e1797beee3","conversationId=":"dc0d27e5-d8eb-41cc-9b7f-89a230b0dfa4","timestamp=":"1472727727416","EJBMethod": "execute","ComponentType": "STATELESS_SESSION_BEAN","ApplicationName": "null","ModuleName": "SimpleWAR","ComponentName": "DemoEJB","EJBClass": "demo.requesttracing.DemoEJB","TX-ID": "JavaEETransactionImpl: txId=402 nonXAResource=null jtsTx=null localTxStatus=0 syncs=[com.sun.ejb.containers.ContainerSynchronization@7a4d066a]","CallerPrincipal": "ANONYMOUS","traceTime=":"246"},
"TraceEvent": {"eventType": "REQUEST_EVENT","eventName":"InterceptedCdiRequest-ENTER","id=":"c0ab2f7a-ca37-4dfd-82de-27a07117b525","conversationId=":"dc0d27e5-d8eb-41cc-9b7f-89a230b0dfa4","timestamp=":"1472727727452","MethodName": "execute","TargetClass": "demo.requesttracing.DemoTrackedCDI$Proxy$_$$_WeldSubclass","traceTime=":"282"},
"TraceEvent": {"eventType": "REQUEST_EVENT","eventName":"InterceptedCdiRequest-EXIT","id=":"ae52efcd-761a-4d5a-971d-f704169c66a6","conversationId=":"dc0d27e5-d8eb-41cc-9b7f-89a230b0dfa4","timestamp=":"1472727727453","MethodName": "execute","TargetClass": "demo.requesttracing.DemoTrackedCDI$Proxy$_$$_WeldSubclass","traceTime=":"283"},
"TraceEvent": {"eventType": "TRACE_END","eventName":"TraceEnd","id=":"288a524c-3d4f-492c-beda-c3accf5d502c","conversationId=":"dc0d27e5-d8eb-41cc-9b7f-89a230b0dfa4","timestamp=":"1472727733456","traceTime=":"6286"}}}]]
The message spans multiple lines and contains information about all the events collected during the execution of a single particular request. Admittedly, it is very hard to read simply because a lot of data was collected. And this is just a very simple request. What may help is that the data in brackets is logged in a format very similar to JSON. If you try to format the messages as JSON, you will get something more readable:
[2016-09-01T13:02:13.456+0200] [Payara 4.1] [INFO] [] [fish.payara.nucleus.notification.service.LogNotifierService] [tid: _ThreadID=100 _ThreadName=http-thread-pool(5)] [timeMillis: 1472727733456] [levelValue: 800] [[
  Request execution time: 6286(ms) exceeded the acceptable threshold -
  {"RequestTrace":
    {"startTime":"1472727727170",
      "elapsedTime":"6286",
      "TraceEvent":
         {"eventType": "TRACE_START",
          "eventName":"StartTrace", ...
When more notifiers are added in the future, it will be much easier to read the data and analyze it using tools like Kibana. It would then be straightforward to get visualizations similar to the one in the beginning of this post.
Give us your feedback & get some Payara swag!
Although the Request Tracing service could potentially be useful in some scenarios already, for now it is still a technical preview. Feel free to try it out and let us know if you find any bugs, anything that might be confusing, unclear or simply not working the way it should. Any ideas for further improvements are also very welcome! You can give us your feedback here in the comments, on GitHub or via email to info@payara.fish . Best / most useful suggestions will be rewarded with some Payara swag!
